The previous article in this series focused on provisioning and configuring MetadataIQ. Now, we turn our attention to actually using it.
After the initial cluster setup and configuration, each additional MetadataIQ job execution will populate the remote ElasticSearch database with updated metadata from the configured dataset.
Periodic synchronizations keep the database updated with new metadata changes, and the recommendation is to configure a dataset-appropriate schedule for the OneFS MetadataIQ job. For example, the following CLI syntax entry will configure a schedule to run the metadata checkpointing job every five minutes:
# isi metadataiq settings modify --schedule "every day every 5 minutes"
With the producer services enabled, the first MetadataIQ cycle will start as soon as a valid schedule has been configured.
Once installed, the basic steps for using the ElasticSearch database and Kibana UI are as follows:
- First, from a browser, navigate to the URL for the Kibana instance. For example:
http://<ip_to_host>:5601/app/home#/
- Log in to Kibana using your ELK credentials (username and password).
For example: Username ‘elastic’ and the corresponding password.
- Optionally, create a ‘dataview’ first by clicking on ‘create’ under the ‘discover’ tab and pasting ‘isi_metadata_index’ or ‘isi*’ as the index pattern.
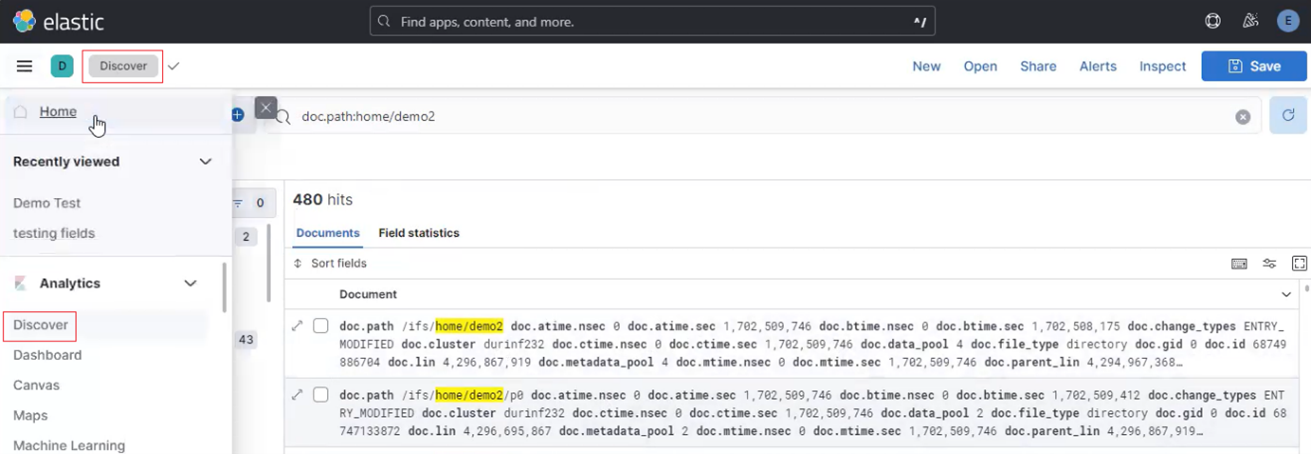
- Use the ‘discover’ option to enter and execute search queries. The ‘discover’ link is typically located in the drop down menu on the top left of the GUI. From this drop down menu, click on ‘discover’ to open a search screen.
- Finally, queries can be entered to analyze the data as appropriate.
The following query syntax illustrates how basic ElasticSearch searches of the OneFS metadata can be expressed. For example:
- To find regular files, residing in pool 3 on a particular cluster (<cluster_name>):
file_type equals regular and doc.metadata_pool equals 3 and doc.cluster equals <cluster_name>
- Or to find files on a particular cluster with a modification time (-mtime) of Monday, October 21, 2024 9:00:00 PM, expressed as an epoch value:
doc.cluster equals <cluster_name> and doc.mtime.sec >= 1729544400
- Additionally, the Kibana ‘dashboard’ can be used to create data visualizations, if desired.
From the Kibana UI, the ‘Discover’ page notifies of a new data source once the ‘isi metadataiq’ utility has been successfully configured and executed on the cluster. For example:

Clicking on the ‘Create data view’ button brings up the ‘Create data view’ page, where the new metadata index (for example, ‘isi_metadata_index’) is recognized and listed as a matching data source. For example:
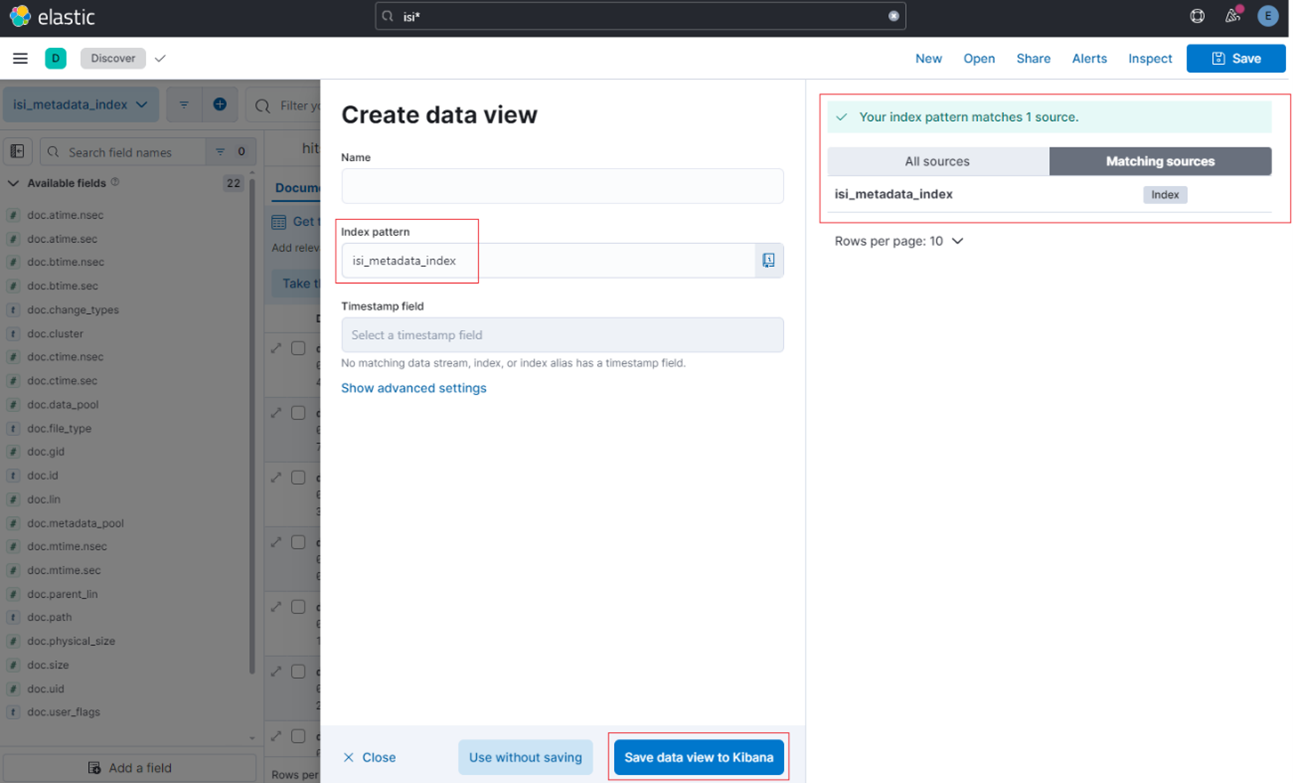
Creating a data view is a simple as entering ‘isi_metadata_index’ in the ‘Index pattern’ search field and clicking the ‘Save data view to Kibana’ button.
The dropdown menu also provides options to manage or add fields to this data view:
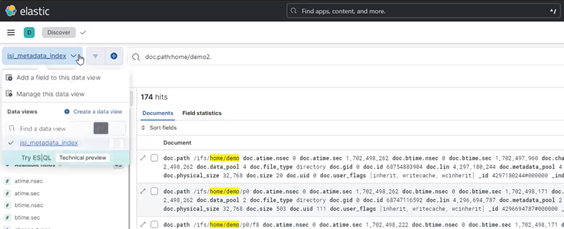
Under the ‘Analytics’ tab, the ‘Discover’ mode enables data queries to be easily crafted and executed:
One or more filters can be easily created to display a desired subset of metadata entries:
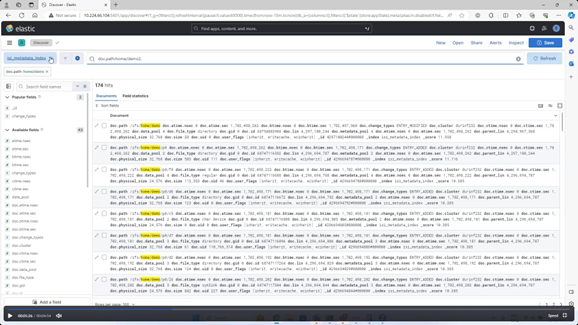
A list of the available fields is displayed on the left of the Kibana page. For example:

(Incomplete list)
Filters can be configured by clicking on the blue ‘plus’ icon to bring up the ‘Add filter’ pane:


From the ‘Add filter’ pane, first add the desired field by searching and selecting from the dropdown list:

In this case the ‘doc.path’ filter is selected:

Next, select an operator from the list:

In this case, the ‘is’ operator is selected. Next, add the dataset’s path under /ifs:
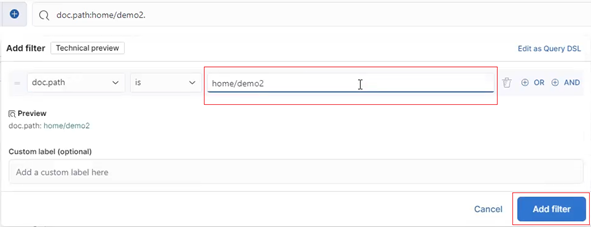
Finally, click the ‘Add filter’ button and the new filter(s) will search for the matching newly generated database entries under the path, in this case ./home/demo2.
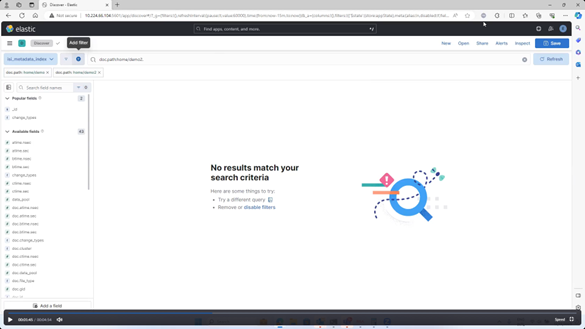
This returns no new entries yet since the MetadataIQ services and ChangeList job are still running:
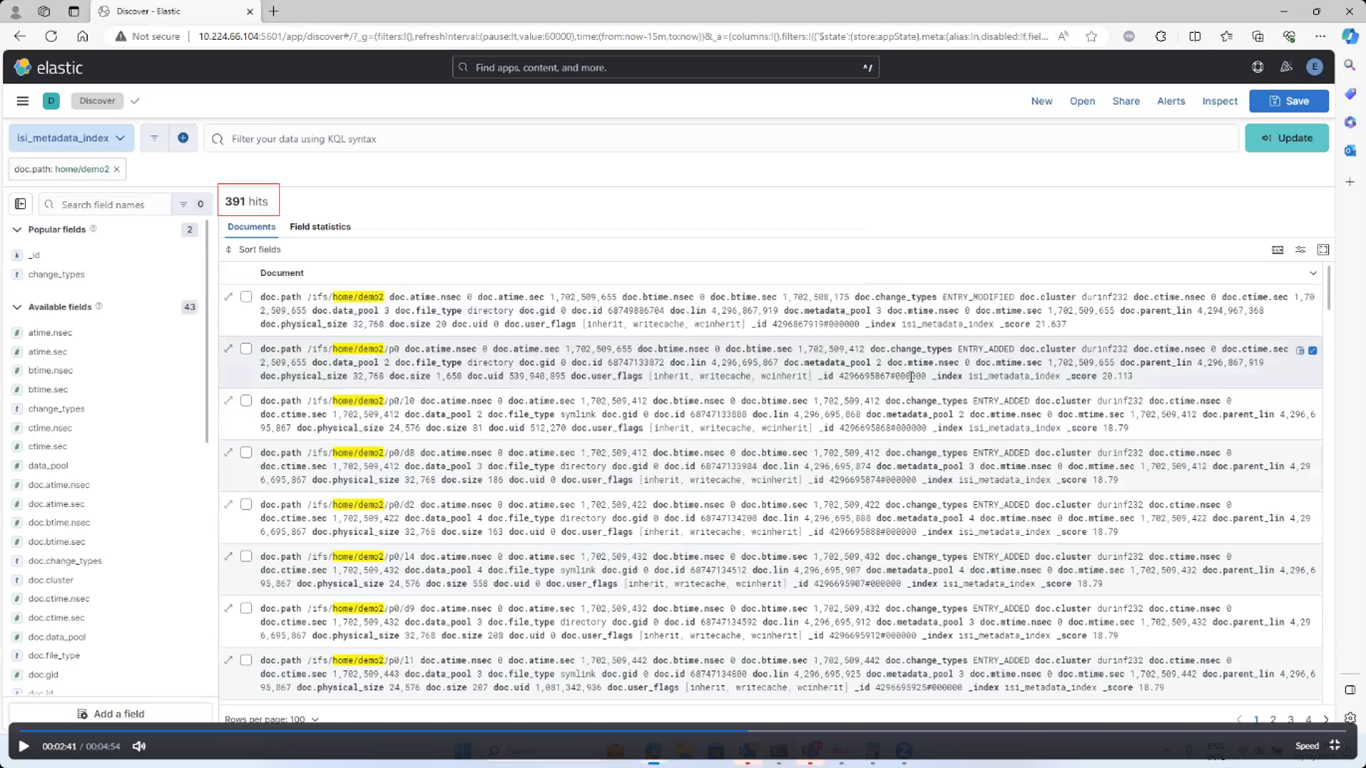
Refreshing the Kibana window with the ‘doc.path’ filter shows the new metadata entries, in this case 391 entries, under /ifs/home/demo2:
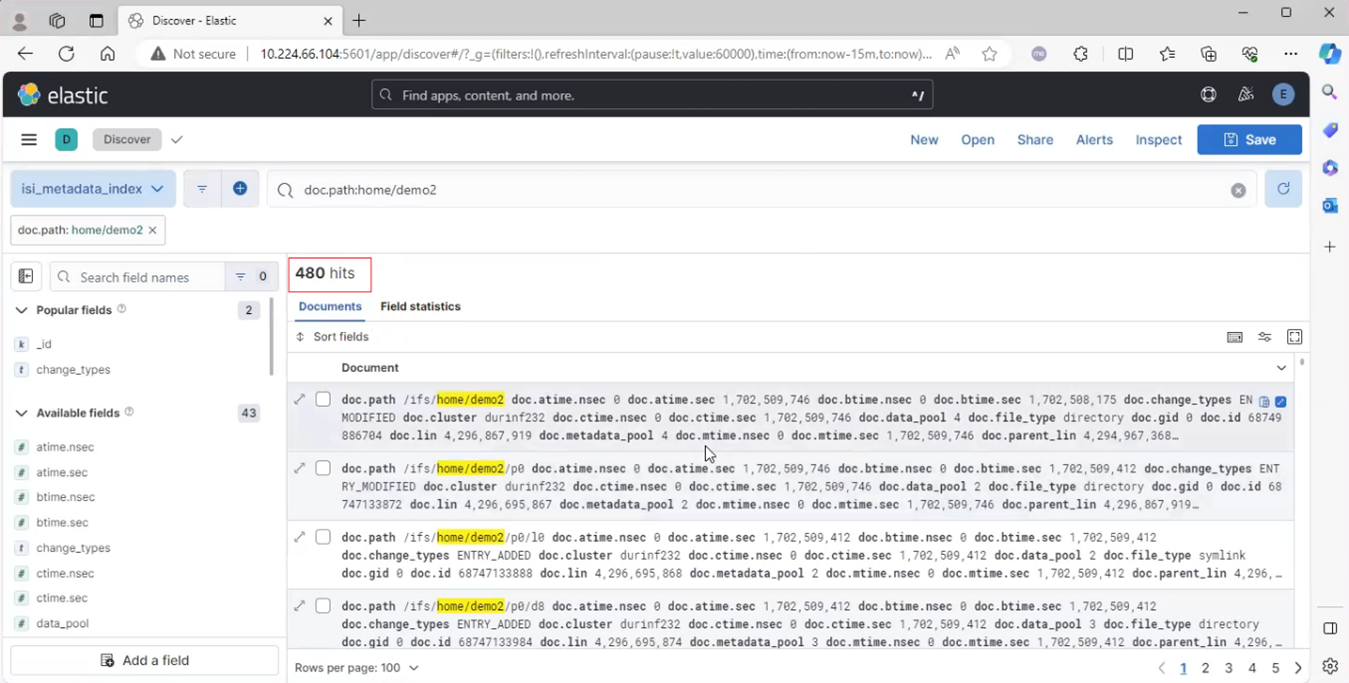
Once the next scheduled MetadataIQ cycle has successfully completed, refreshing the Kibana UI reports any changes in the number of ‘doc.path’ entries, or ‘hits’, in this case from 391 to 480.
The standard MetadataIQ configuration captures all of the ChangeList output into each document, so this can be either queried directly or represented graphically.
Within the Kibana UI, under the ‘Analytics’ tab, moving from ‘Discover’ mode to ‘Dashboard’ allows rich custom visualizations to be created:
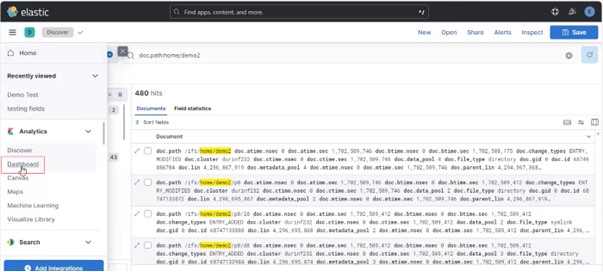
Kibana provides multiple data presentation options. Bar charts can be useful for representing to the ‘file and physical size distributions’ data:
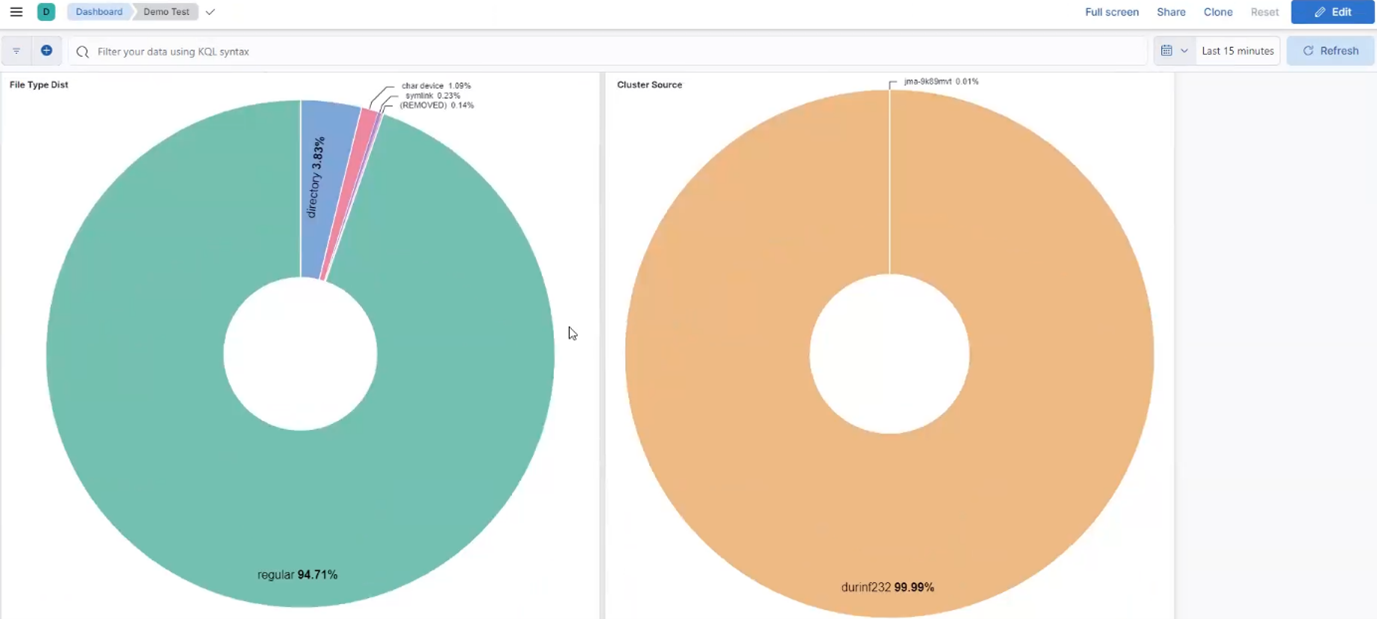
Pie charts can be helpful with illustrating metadata fields from multiple clusters. Up-leveled data can be collated and represented in the Kibana dashboard as interactive charts, the details of which can easily be drilled down into by clicking on the desired region. For example, the ‘file type and cluster source’ distribution metrics below:
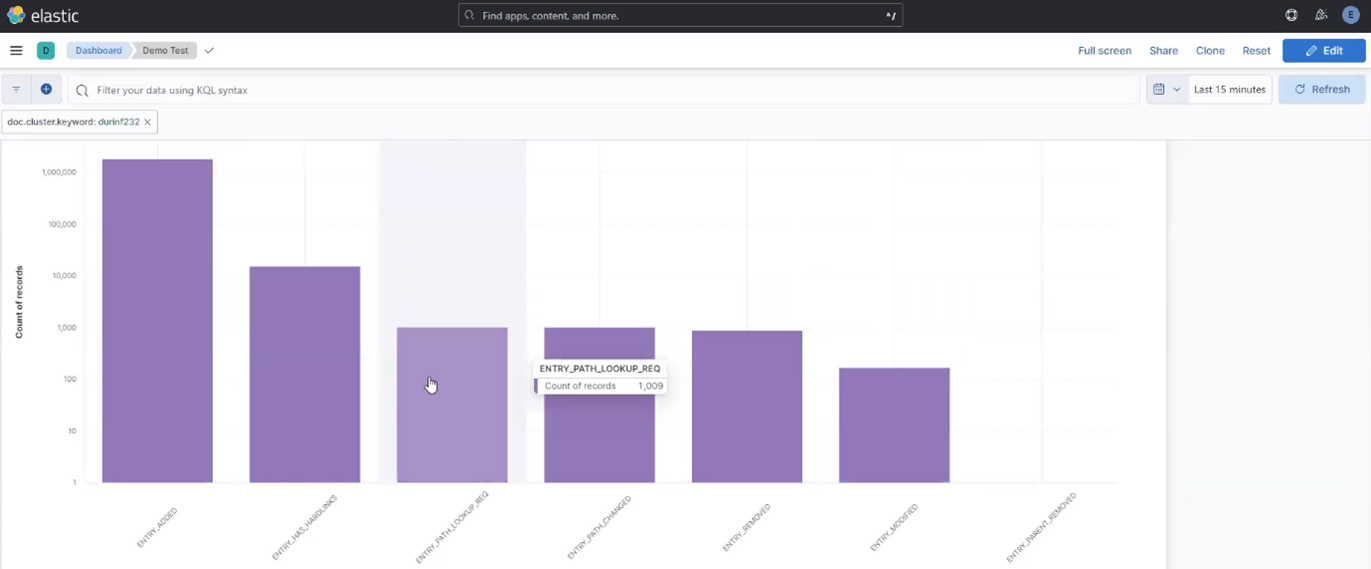
The following chart displays the ‘entry path changed’ field from the ‘top 10 values of change_types’. Additional context for a chart region or field can be viewed with Kibana’s mouse ‘hover-over’ functionality:
In the final article in this series, we’ll examine the tools and options available for monitoring and troubleshooting MetadataIQ.