OneFS and NFS over RDMA Support

Over the last couple of decades, the ubiquitous network file system (NFS) protocol has become near synonymous with network attached storage. Since its debut in 1984, the technology has matured to such an extent that NFS is now deployed by organizations large and small across a broad range of critical production workloads. Currently, NFS is the OneFS file protocol with the most stringent performance requirements, serving key workloads such as EDA, artificial intelligence, 8K media editing and playback, financial services, and other branches of commercial HPC.

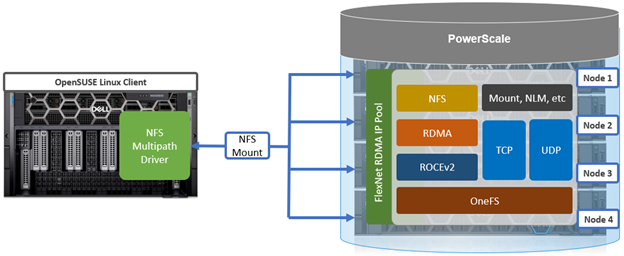
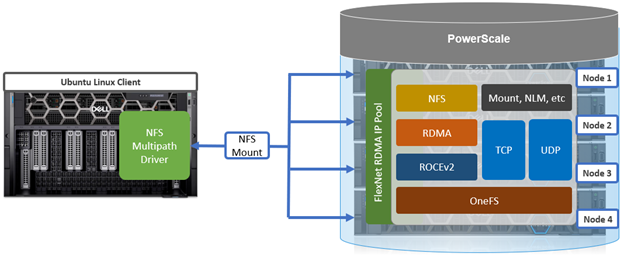
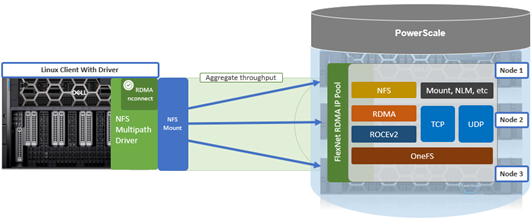
At its core, NFS over Remote Direct Memory Access (RDMA), as spec’d in RFC8267, enables data to be transferred between storage and clients with better performance and lower resource utilization than the standard TCP protocol. Network adapters with RDMA support, known as RNICs, allow direct data transfer with minimal CPU involvement, yielding increased throughput and reduced latency. For applications accessing large datasets on remote NFS, the benefits of RDMA include:

Benefit Detail
Low CPU utilization Leaves more CPU cycles for other applications during data transfer.
Increased throughput Utilizes high-speed networks to transfer large data amounts at line speed.
Low latency Provides fast responses, making remote file storage feel more like directly attached storage.
Emerging technologies Provides support for technologies such as NVIDIA’s GPUDirect, which offloads I/O directly to the client’s GPU.

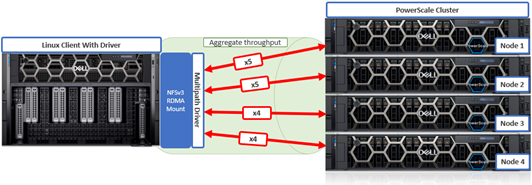
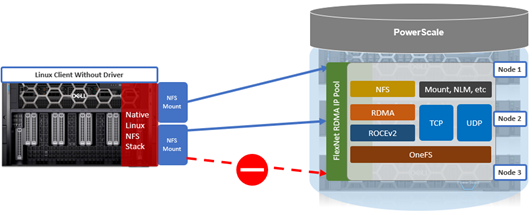
Network file system over remote direct memory access, or NFSoRDMA, provides remote data transfer directly to and from memory, without CPU intervention. PowerScale clusters have offered NFSv3 over RDMA support, and its associated performance benefits, since its introduction in OneFS 9.2. As such, enabling this functionality under OneFS allows the cluster to perform memory-to-memory transfer of data over high speed networks, bypassing the CPU for data movement and helping both reduce latency and improve throughput.

Because OneFS already had support for NFSv3 over RDMA, extending this to NFSv4.x in OneFS 9.8 focused on two primary areas:

  • Providing support for NFSv4 compound operations.
  • Enabling native handling of the RDMA headers which NFSv4.1 uses.

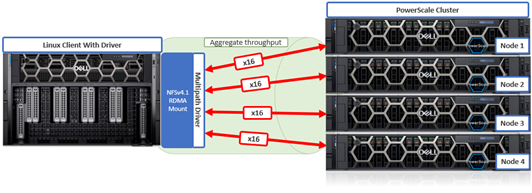
So with OneFS 9.8 and later, clients can connect to PowerScale clusters using any of the current transport protocols and NFS versions – from v3 to v4.2:

Protocol RDMA TCP UDP
NFS v3 x x x
NFS v4.0 x x
NFS v4.1 x x
NFS v4.2 x x

The NFS over RDMA global configuration options in both the WebUI and CLI have also been simplified and genericized, negating the need to specify a particular NFS version:

And from the CLI:

# isi nfs settings global modify --nfs-rdma-enabled=true

A PowerScale cluster and client must meet certain prerequisite criteria in order to use NFS over RDMA.

Specifically, from the cluster side:

Requirement Details
Node type F210, F200, F600, F710, F900, F910, F800, F810, H700, H7000, A300, A3000
Network card (NIC) NVIDIA Mellanox ConnectX-3 Pro, ConnectX-4, ConnectX-5, ConnectX-6 network adapters which support 25/40/100 GigE connectivity.
OneFS version OneFS 9.2 or later for NFSv3 over RDMA, and OneFS 9.8 or later for NFSv4.x over RDMA.

Similarly, the OneFS NFSoRDMA implementation requires any NFS clients using RDMA to support ROCEv2 capabilities. This may be either client VMs on a hypervisor with RDMA network interfaces, or a bare-metal client with RDMA NICs. OS-wise, any Linux kernel supporting NFSv4.x and RDMA (Kver 5.3+) can be used, but RDMA-related packages such as ‘rdma-core’ and ‘libibvers-utils’ will also need to be installed. Package installation is handled via the Linux distribution’s native package manager.

Linux Distribution Package Manager Package Utility
OpenSUSE RPM Zypper
RHEL RPM Yum
Ubuntu Deb Apt-get / Dpkg

For example, on an OpenSUSE client:

# zypper install rdma-core libibvers-utils

Plus additional client configuration is also required, and this procedure is covered in detail below.

In addition to a new ‘nfs-rdma-enabled’ NFS global config setting (deprecating the prior ‘nfsv3-rdma-enabled setting), OneFS 9.8 also adds a new ‘nfs-rroce-only’ network pool setting. This allows the creation of an RDMA-only network pool that can only contain RDMA-capable interfaces. For example:

# isi network pools modify <pool_id> --nfs-rroce-only true

This is ideal for NFS failover purposes because it can ensure that a dynamic pool will only fail over to an RDMA-capable interface.

OneFS 9.8 also introduces a new NFS over RDMA CELOG event:

# isi event types list | grep -i rdma

400140003  SW_NFS_CLUSTER_NOT_RDMA_CAPABLE             400000000  To use the NFS-over-RDMA feature, the cluster must have an RDMA-capable front-end Network Interface Card.

This event will fire if the cluster transitions from being able to support RDMA to not, or if attempting to enable RDMA on a non-capable cluster. The previous ‘SW_NFSV3_CLUSTER_NOT_RDMA_CAPABLE’ in OneFS 9.7 and earlier is also deprecated.

When it comes to TCP/UDP port requirements for NFS over RDMA, any environments with firewalls and/or packet filtering deployed should ensure the following ports are open between PowerScale cluster and NFS client(s):

Port Description
4791 RoCEv2 (UDP) for RDMA payload encapsulation.
300 Used by NFSv3 mount service.
302 Used by NFSv3 network status monitor (NSM).
304 Used by NFSv3 network lock manager (NLM).
111 RPC portmapper for locating services like NFS and mountd.

NFSv4 over RDMA does not add any new ports or outside cluster interfaces or interactions to OneFS, and RDMA should not be assumed to be more or less secure than any other transport type. For maximum security, NFSv4 over RDMA can be configured to use a central identity manager such as Kerberos.

Telemetry-wise, the ‘isi statistics’ configuration in OneFS 9.8 includes a new ‘nfsv4rdma’ switch for v4, in addition to the legacy ‘nfsrdma’ (where ‘nfs4rdma’ includes all the 4.0, 4.1 and 4.2 statistics).

The new NFSv4 over RDMA CLI statistics options in OneFS 9.8 include:

Command Syntax Description
isi statistics client list –protocols=nfs4rdma Display NFSv4oRDMA cluster usage statistics organized according to cluster hosts and users.
isi statistics protocol list –protocols=nfs4rdma Display cluster usage statistics for NFSv4oRDMA
isi statistics pstat list –protocol=nfs4rdma Generate detailed NFSv4oRDMA statistics along with CPU, OneFS, network and disk statistics.
isi statistics workload list –dataset= –protocols=nfs4rdma Display NFSv4oRDMA workload statistics for specified dataset(s).

For example:

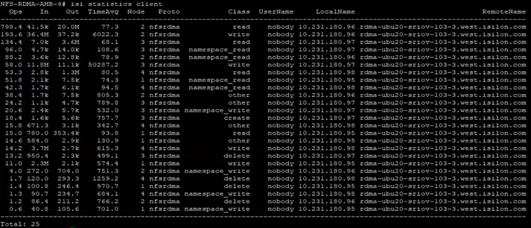
# isi statistics client list --protocols nfs4rdma  Ops     In    Out  TimeAvg  Node    Proto           Class   UserName     LocalName                    RemoteName------------------------------------------------------------------------------------------------------------------629.8  13.4k  62.1k    711.0     8 nfs4rdma  namespace_read    user_55  10.2.50.65   10.2.50.165605.6  16.9k  59.5k    594.9     4 nfs4rdma  namespace_read    user_254 10.2.50.66  10.2.50.166451.0   3.7M  41.5k   1948.5     1 nfs4rdma           write    user_74  10.2.50.72  10.2.50.172240.7 662.8k  18.1k    279.4     8 nfs4rdma          create    user_55  10.2.50.65 10.2.50.165

Additionally, session-level visibility and additional metrics can be gleaned from the ‘isi_nfs4mgmt’ utility, provides insight on a client’s cache state. The command output shows which clients are connected via RDMA or TCP from the server, in addition to their version. For example:

# isi_nfs4mgmt

ID                  Vers   Conn     SessionId   Client Address      Port  O-Owners Opens    Handles  L-Owners

1196363351478045825  4.0   tcp        -         10.1.100.110      856   1        7        10       0

1196363351478045826  4.0   tcp        -         10.1.100.112      872   0        0        0        0

2940493934191674019  4.2   rdma   3         10.2.50.227      40908 0       0         0         0

2940493934191674022  4.1   rdma    5        10.2.50.224      60152 0       0          0        0

The output above indicates two NFSv4.0 TCP sessions, plus one NFSv4.1 RDMA session and one NFSv4.1 RDMA session.

Used with the ‘—dump’ flag and client ID, isi_nfs4mgt will provide detailed information for a particular session:

# isi_nfs4mgmt --dump 2940493934191674019

Dump of client 2940493934191674019

Open Owners (0):

Session ID: 3

Forward Channel Connections: Remote: 10.2.50.227.40908 Local: 10.2.50.98.20049
....

Note that the ‘isi_nfs4mgmt’ tool is specific to stateful NFSv4 sessions and will not list any stateless NFV3 activity.

In the next article in this series, we’ll explore the procedure for enabling NFS over RDMA on a PowerScale cluster.

OneFS Routing and SBR – Part 2

As we saw in the previous article in this series, the primary effect of OneFS source-based routing (SBR) is helping to ensure that the cluster replies on the same interface as the ingress packet came in on. This happens automatically in conjunction with FlexNet’s NIC affinity.

Each of a cluster’s front-end subnets contains one or more pools of IP addresses which can be bound to external interfaces of nodes in the cluster. Pools also bind to a groupnet and associated access zone for multi-tenant authentication management, etc.

A cluster’s network pools each include a range of addresses, a list of interfaces, an aggregation mode, and a list of static routes. Static Routes can be configured on a per-pool basis. Unlike SBR, static routes provide a mechanism to force all traffic for a specific destination to use a specific address and a specific gateway. This means static routes, unlike SBR, can support client services without making those services zone-aware.

OneFS SBR will often simply just do the right thing with little or no additional configuration required. Therefore it is generally the preferred option, and indeed is the default for new clusters running OneFS 9.8 or later. That said, in order for SBR to create its IPFW  rule for a gateway, there must have been a session initiated from the source subnet in order to initiate it. If no traffic has been originated or received from a network that’s unreachable via the default gateway, OneFS will transmit traffic it originates through the default gateway. Static routes are an option in this case.

Static routes are also an alternative when SBR cannot do what is required – for example, if different subnets must be treated differently, or a customer actually requires the route from A to B to be different from the route from B to A.

Static routes can be easily added from the CLI with the following syntax:

 # isi network pools <pool> --static-routes<subnet_ip_address>/<CIDR_netmask>-<gateway_ip_address>

Where the first address and the integer form a netmask, and the second address is a gateway. Static routes are configured on a per-pool basis. For example:

# isi network pools groupnet0.subnet0.pool0 -–static-routes 10.30.1.0/22-10.30.1.1

Similarly, an individual static route can be removed as follows:

# isi network pools groupnet0.subnet0.pool0 –-remove-static-routes 10.30.1.0/22-10.30.1.1

Static routes are not mutually exclusive to SBR, but they do operate slightly differently when SBR is enabled. SBR just changes the way an egress packet is handled. Instead of matching a packet to a route based off the destination IP in the packet header, SBR uses the source IP of the packet instead.

Before changing the current SBR state on a cluster, the following CLI syntax can be used to confirm whether there are static routes configured in any IP address pools:

# isi network pools list –v | grep -i routes

If needed, all or a pool’s static routes can be easily removed as follows:

# isi network pools modify <pool_id> --clear-static-routes

When SBR parses the ipfw rule list in order to set the route, static routes take priority and are evaluated first. Under SBR, the narrowest route is preferred. This means that a CIDR /30 route that matches will be selected before a matching /28, etc. If no match is found, SBR then tries the subnet routes.

Clearly, static routes do have some notable limitations. By definition, they would need to include every destination address range in order to properly direct traffic – and this may be a large and changing set of information. Additionally, static routes can only direct traffic based on remote IP address. If multiple workflows use the same remote IP addresses, static routing cannot treat them differently.

Take the following multi-subnet topology example, where a client is three hops from a PowerScale cluster:

If the source IP address and the destination IP address both reside within the same subnet (ie. within the same ‘layer 2’ broadcast domain), the packet goes directly to the client’s IP address. Conversely, if the destination IP address is in a different subnet from the source, the packet is sent to the next-hop gateway.

In the above example, the client initiates a connection to the cluster at IP address 10.30.1.200:

First, the client determines that the destination IP address is not on its local network, and that it does not have a static route defined for that address. It then sends the packet to its default gateway (Gateway C) for more processing.

Next, the router at gateway C receives the client’s packet, examines the destination IP in the packet header, and determines that it has a route to the destination through router A at 10.30.1.1.

Since Router A has a direct connection on the 100GbE subnet to the destination IP address, it sends the packet directly to the cluster’s 10.30.1.200 interface.

At this point, OneFS must send a response packet to the client.

1. If SBR is disabled, the node determines that the client (10.2.1.50) is not on the same subnet and does not have a static route defined for that address. OneFS determines which gateway it must send the response packet to based upon the routing table.

Gateways with higher priority (lower value) have precedence over those with lower priority (higher value). For example, 1 has a higher priority than 10. The PowerScale node has one default gateway, which is the highest priority subnet the node is configured in. Since there is no static route configured on the node, OneFS chooses the default gateway 10.10.1.1 (router B) via the 10GbE interface.

The reply packet sent by the 10GbE interface has a source IP header of 10.30.1.200. Note that some firewalls or packet filters may interpret this as packet ‘spoofing’ and automatically block this type of behavior. Additionally, perceived performance asymmetry may also be an issue, since the connection may be bandwidth constrained because of the 10GbE link. In this case, a user may anticipate 100GbE performance but in actuality will limited to only a 10GbE connection.

2. Conversely, if SBR is enabled, the cluster node’s routing decisions are no longer predicated on the client’s destination IP address. Instead, OneFS parses the egress packet source IP header, then sends the packet via the gateway associated with the source IP subnet.

The node’s reply packet has a source IP address of 10.30.1.200 and, as such, the SBR routing rules indicate the preferred gateway is A (10.30.1.1) on the 100GbE subnet. When the response reaches gateway A, it is routed back to Gateway C across the core network to the client.

Note, however, that SBR will not override any statically configured routes. If SBR is enabled and a static route is created, a new ipfw rule is added. Since SBR only acts upon ‘reply’ packets, any traffic initiated by the node is unaffected. For example, when a node contacts a DNS or AD server, traditional routing rules (as though SBR is disabled) apply. Also, be aware that enabling SBR is a global (cluster-wide) action, and OneFS does not currently allow for SBR configuration at a groupnet, subnet, or pool-level granularity.

In addition to SBR, a number of other FlexNet networking configurations are either cluster-wide, or effectively amount to it:

Networking Component Description
DNS DNS, including the DNS caching daemon, operates cluster-wide.
Default gateway While the default gateway as a routing mechanism may appear to be subnet-specific in the UI, it behaves globally.
NTP The network time protocol (NTP) is configured and runs global to maintain time synchronization between the cluster’s nodes, domain controllers, and other servers and networked devices.
SBR While SBR is a cluster-wide setting, the routing changes will be specific to the routing tables on each individual node (each node’s routing table will be specific to the network pools it is a part of).

Note that, being global configuration, enabling SBR can affect other workflows as well.

Within Flexnet, each subnet has its own address space, with is specified by a base and netmask, gateway, VLAN tag, SmartConnect service address, and aggregation options (DSR return addresses).

While SBR is a cluster-wide setting, though the routing changes will be specific to the rules/routing tables on each individual node (each node’s routing table will be specific to the network pools it is a part of).

One quirk of subnet configuration is that, while each subnet can have a different default gateway configured, normally OneFS only uses the highest priority gateway configured in any of its subnets – falling back to lower-priority only if it is unreachable.

SBR aims to mitigate this idiosyncrasy, enforcing subnet settings by automatically creating IPFW rules based on subnet settings. This allows connections associated with a given subnet to use the specified gateway for that subnet, but only for connections bound to a specific local address within that subnet. This means they work only for incoming connections or outgoing connections that are made in a tenant-aware way; the common practice of clients binding to INADDR_ANY and letting the network stack choose which local address to use prevents SBR from working. Most client services running under OneFS (e.g. integration with authentication servers like LDAP and AD) therefore cannot currently use SBR.

OneFS Routing and SBR

The previous article on this topic generated several questions, which suggested that a more thorough exploration of OneFS source-based routing (SBR) is likely warranted. So here goes…

At its essence, network routing is the process of selecting a path for data traffic, either within a network or traversing multiple networks. The aim is to endure efficient data flow across subnets, while maintaining bandwidth and minimizing congestion. Routers, layer 3 switches, multi-homed system, etc, make routing decisions based on packet header addresses and routing tables, which record the paths packets should take to reach their destinations.

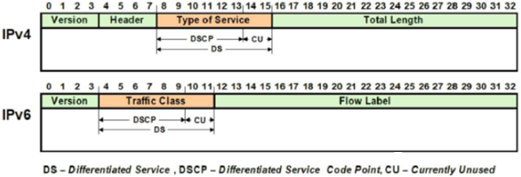
IP packet headers have the following form, with the source and destination addresses located towards the end of the header section, before the packet’s payload.

Routing is typically either static, using manually enter routing statements and rules, or dynamic, via routing protocols such as RIP, OSPF, etc.

While the nomenclature might suggest that OneFS source-based routing would route traffic based on a source IP address, instead SBR actually operates by dynamically creating per-subnet default routes. The gateway is derived from the subnet configuration, and, as such, gateways need to be defined for each subnet.

New cluster deployments running OneFS 9.8 and automatically have SBR enabled, whereas legacy clusters upgrading to 9.8 preserve their existing SBR configuration, whether on or off. While SBR is disabled by default in OneFS 9.7 and earlier releases, it can, if desired, be easily enabled from either the CLI or WebUI.

SBR is configured globally and, as such, is either on or off across the entire cluster and its network pools and subnets. OneFS 9.7 and earlier supports only the IPv4 protocol, whereas OneFS 9.8 and later also accommodate IPv6 subnets.

SBR can be instantly enabled on a PowerScale cluster by running the following CLI command:

# isi network external modify --sbr 1

# isi network external view | grep -i source

Source Based Routing: True

Or from the WebUI under Cluster management > Network configuration > Settings:

Similarly, SBR can be disabled as follows:

# isi network external modify --sbr 0

# isi network external view | grep -i source

Source Based Routing: False

Under the hood, SBR uses the FreeBSD ‘ipfw’ utility (as does the OneFS firewall) to record and manage its routing rules.

For example, with SBR disabled, querying ipfw on a cluster shows a single ‘any to any’ rule:

# isi network external view | grep -i source

Source Based Routing: False

# ipfw show

65535 11839927994 7560033188891 allow ip from any to any

By way of contrast, when SBR is enabled, a number of new, higher priority ‘allow’ rules for each NIC and gateway ‘fwd’ rules are added above the ‘any to any’ rule:

# isi network external view | grep -i source

Source Based Routing: True

# ipfw show

60000          16         33391 allow ip from any to any via lo0 out

60001           0             0 allow ip from any to ff02::1:ff00:0/104 out

60002      116082     112914089 allow ip from any to any via mce0 out

60003      217150     138771611 allow ip from any to any via mce1 out

60004           0             0 allow ip from any to any via ue0 out

60005           0             0 allow ip from any to fe80::/10 out

60006           0             0 allow ip from any to ff02::1 out

62000           0             0 fwd 2620:0:170:7c0f::1 ip from 2620:0:170:7c0f::/64 to not 2620:0:170:7c0f::/64 out

62001         121         94788 fwd 10.30.1.1 ip from 10.30.1.0/22 to not 10.30.1.0/22 out

65535 11842048952 7561181109905 allow ip from any to any

In this example node’s case, on a cluster running OneFS 9.8, there is one IPv4 subnet and one IPv6 subnet:

# isi network subnets list

ID                Subnet    Gateway|Priority      Pools     SC Service Addrs     Firewall Policy

------------------------------------------------------------------------------------------------

groupnet0.subnet0 10.30.1.0/22   10.30.1.1|10     pool0     10.30.1.100-10.30.1.110               default_subnets_policy

groupnet0.subnet1 2620:0:170:7c0f::/64 2620:0:170:7c0f::1|20 ipv6pool  2620:0:170:7c0f::4-2620:0:170:7c0f::4 default_subnets_policy

------------------------------------------------------------------------------------------------

Total: 2

So enabling SBR on this cluster results in the creation of a ‘fwd’ rule for each subnet:

# ipfw show | grep fwd

62000          33          2640 fwd 2620:0:170:7c0f::1 ip from 2620:0:170:7c0f::/64 to not 2620:0:170:7c0f::/64 out

62001      145794     140490002 fwd 10.30.1.1 ip from 10.30.1.0/22 to not 10.30.1.0/22 out

Please note that the ‘ipfw’ command should not be used to modify the OneFS routing rules (or firewall table) directly!

By way of a OneFS packet routing example, take the following network topology where three clients, each on separate subnets, are connecting to a PowerScale cluster:

The default gateway is the path for all traffic intended for clients not on the local subnet and not covered by a routing table entry. Utilizing SBR does not negate the need for a default gateway, since SBR effectively overrides the default gateway (but not static routes).

Note that SBR is not simple packet reflection. Instead, it’s the dynamic creation of per-subnet default routes. The router used as the gateway is derived from the FlexNet subnet definitions within the subnet configuration. As such, a gateway needs to be specified for each subnet.

 In addition to a gateway address, each subnet also has a defined priority. For example:

Or via the CLI:

# isi network subnets modify groupnet0.subnet1 --gateway 10.30.1.1 --gateway-priority 10

With SBR disabled, the highest priority gateway (ie. the gateway with the lowest reachable value) is used as the default route.

Once SBR is enabled, OneFS examines the FlexNet config for each subnet, and then creates ipfw rules that look at the source IP address from the cluster side and force the next-hop to be the gateway IP defined for the subnet which contains that IP address.

In the previous example with three clients on separate subnets connecting to a cluster, when traffic arrives from a subnet that is unreachable via the default gateway, the following routing rules will be added via ipfw:

The mechanism for adding ipfw rules is stateless, and SBR relies on the source IP address that transmits traffic to the cluster.

A session must be initiated from the source subnet for a corresponding ipfw rule to be created. Also, unless the cluster has received traffic that originated from a subnet has no route to the default gateway, OneFS transmits traffic it originates through the default gateway.

In the next article in this series. We’ll take a look at SBR and its interrelationship with static routes and other OneFS networking components.

OneFS Source Based Routing for IPv6 Networks

Tucked amongst the OneFS 9.8 feature payload were a couple of significant enhancements to source-based routing (SBR). Specifically, the introduction of:

  • IPv6 network support.
  • SBR enabled by default for fresh OneFS 9.8 installs.

Source-based routing was first introduced into OneFS back in 9.2. At its core, OneFS source base routing is essentially ‘per-subnet default routes’. OneFS parses the Flexnet configuration for each subnet, and then creates routing rules corresponding to the IP address from the cluster side, forcing the next-hop to be the router IP defined for the subnet which contains that IP address.

Until OneFS 9.8, SBR was disabled by default, and so required manual configuration in order to run it. Additionally, in OneFS 9.7 and earlier, SBR only supported IPv4 networks. With the release of OneFS 9.8, both IPv4 and IPv6 networks are now fully supported. Plus, for new clusters and fresh installs, SBR is now enabled by default. However, existing clusters that are upgraded to OneFS 9.8 will retain their existing configuration. So SBR will remain disabled unless it had already been configured to run.

When SBR is disabled and a request comes in from a client and is routed to a node in the cluster, when the return traffic is sent it will typically traverse the cluster’s default route.

With a large number of clients connected, there is a possibility of overloading the default route with a deluge of traffic. However, when SBR is enabled, each subnet has a defined priority gateway and return traffic is sent over the path that the request came from rather than the default route.

If traffic arrives from a subnet that isn’t reachable through the default gateway, routing rules are added for it. These rules are stateless and depend entirely on the source IP that sends traffic to the cluster.

So, with a well-balanced client network topology, client connects will follow their source routes and load will be automatically distributed more evenly and bi-directionally over the source paths, rather than returning across the cluster’s default route. This has the potential benefit of network performance improvements in addition to a more even distribution.

From the OneFS CLI, the ‘isi network external view’ command can be used to check the state of the external network configuration, as well as configure SBR.

For example:

# isi network external view

    Client TCP Ports: 2049, 445, 20, 21, 80

    Default Groupnet: groupnet0

  SC Rebalance Delay: 0

Source Based Routing: False

       SC Server TTL: 900


IPv6 Settings:

                   IPv6 Enabled: True

IPv6 Auto Configuration Enabled: False

       IPv6 Generate Link Local: False

          IPv6 Accept Redirects: False

                       IPv6 DAD: Disabled

          IPv6 SSIP Perform DAD: False

In the example above, SBR is disabled, but can be easily enabled as follows:

# isi network external modify --sbr=true

# isi network external view | grep -i source

Source Based Routing: True

Similarly the following syntax will disable SBR:

# isi network external modify --sbr=false

# isi network external view | grep -i source

Source Based Routing: False

SBR can also be configured from the OneFS WebUI by navigating to Cluster management > Network configuration > Settings:

Under the hood, SBR uses ipfw, to create and manage its routing rules. For example,  the following CLI output shows the two corresponding ipfw rules (62000 and 62001) that are created for IPv4 and IPv6 respectively when SBR is enabled:

PowerScale F910 Platform

In this article, we’ll take a quick peek at the new PowerScale F910 hardware platform that was released last week. Here’s where this new node sits in the current hardware hierarchy:

The PowerScale F910 is the high-end all-flash platform that utilizes a dual-socket 4th gen Zeon processor with 512GB of memory and twenty four NVMe drives, all contained within a 2RU chassis. Thus, the F910 offers a generational hardware evolution, while also focusing on environmental sustainability, reducing power consumption and carbon footprint, and delivering blistering performance. This makes the F910 and ideal candidate for demanding workloads such as M&E content creation and rendering, high concurrency and low latency workloads such as chip design (EDA), high frequency trading, and all phases of generative AI workflows, etc.

An F910 cluster can comprise between 3 and 252 nodes. Inline data reduction, which incorporates compression, dedupe, and single instancing, is also included as standard to further increase the effective capacity.

The F910 is based on the 2U R760 PowerEdge server platform, with dual socket Intel Sapphire Rapids CPUs. Front-End networking options include 100/25 GbE and with 100 GbE for the Back-End network. As such, the F910’s core hardware specifications are as follows:

Attribute F910 Spec
Chassis 2RU Dell PowerEdge R760
CPU Dual socket, 24 core Intel Sapphire Rapids 6442Y @2.6GHz
Memory 512GB Dual rank DDR5 RDIMMS (16 x 32GB)
Journal 1 x 32GB SDPM
Front-end network 2 x 100GbE or 25GbE
Back-end network 2 x 100GbE
Management port LOM (LAN on motherboard)
PCI bus PCIe v5
Drives 24 x 2.5” NVMe SSDs
Power supply Dual redundant 1400W 100V-240V, 50/60Hz

These node hardware attributes can be easily viewed from the OneFS CLI via the ‘isi_hw_status’ command. Also note that, at the current time, the F910 is only available in a 512GB memory configuration.

Starting at the business end of the node, the front panel allows the user to join an F910 to a cluster and displays the node’s name once it has successfully joined:

As with all PowerScale nodes, the front panel display provides some useful current node environmentals telemetry. The ‘check’ button activates the panel and the ‘arrow’ buttons scroll to navigate, with the initial options being ‘Setup’ or View’, as below:

After selecting ‘View’, the menu presents ‘Power’ or ‘Thermal’:

Available thermal stats include BTU/hour:

Node temperature:

Air flow in cubic ft per minute (CFM):

Removing the top cover, the internal layout of the F910 chassis is as follows:

The Dell ‘Smart Flow’ chassis is specifically designed for balanced airflow, and enhanced cooling is primarily driven by four dual-fan modules. These fan modules can be easily accessed and replaced as follows:

Additionally, the redundant power supplies (PSUs) also contain their own air flow apparatus and can be easily replaced from the rear without opening the chassis. In the event of a power supply failure, the iDRAC LED on the rear panel of the node will turn orange:

Additionally, the front panel LCD display will indicate a PSU or power cable issue:

And the amber fault light on the front panel will illuminate at the end corresponding to the faulty PSU:

For storage, each PowerScale F910 node contains ten NVMe SSDs, which are currently available in the following capacities and drive styles:

Standard drive capacity SED-FIPS drive capacity SED-non-FIPS drive capacity
3.84 TB TLC 3.84 TB TLC
7.68 TB TLC 7.68 TB TLC
15.36 TB QLC Future availability 15.36 TB QLC
30.72 TB QLC Future availability 30.72 TB QLC

Note that 15.36TB and 30.72TB SED-FIPS drive options are planned for future release.

Drive subsystem-wise, the PowerScale F910 2RU chassis is fully populated with twenty four NVMe SSDs. These are housed in drive bays spread across the front of the node as follows:

The NVMe drive connectivity is across PCIe lanes, and these drives use the NVMe and NVD drivers. The NVD is a block device driver that exposes an NVMe namespace like a drive and is what most OneFS operations act upon, and each NVMe drive has a /dev/nvmeX, /dev/nvmeXnsX and /dev/nvdX device entry  and the locations are displayed as ‘bays’. Details can be queried with OneFS CLI drive utilities such as ‘isi_radish’ and ‘isi_drivenum’. For example:

# isi_drivenum

Bay  0   Unit 15     Lnum 9     Active      SN:S61DNE0N702037   /dev/nvd5

Bay  1   Unit 14     Lnum 10    Active      SN:S61DNE0N702480   /dev/nvd4

Bay  2   Unit 13     Lnum 11    Active      SN:S61DNE0N702474   /dev/nvd3

Bay  3   Unit 12     Lnum 12    Active      SN:S61DNE0N702485   /dev/nvd2

<snip>

Moving to the back of the chassis, the rear of the F910 contains the power supplies, network, and management interfaces, which are arranged as follows:

The F910 nodes are available in the following networking configurations, with a 25/100Gb ethernet front-end and 100Gb ethernet back-end:

Front-end NIC Back-end NIC F910 NIC Support
100GbE 100GbE Yes
100GbE 25GbE No
25GbE 100GbE Yes
25GbE 25GbE No

Note that, like the F710 and F210, an Infiniband backend is not supported on the F910 at the current time. Although this option will be added in due course.

These NICs and their PCI bus addresses can be determined via the ’pciconf’ CLI command, as follows:

# pciconf -l | grep mlx

mlx5_core0@pci0:23:0:0: class=0x020000 card=0x005815b3 chip=0x101d15b3 rev=0x00 hdr=0x00

mlx5_core1@pci0:23:0:1: class=0x020000 card=0x005815b3 chip=0x101d15b3 rev=0x00 hdr=0x00

mlx5_core2@pci0:111:0:0:        class=0x020000 card=0x005815b3 chip=0x101d15b3 rev=0x00 hdr=0x00

mlx5_core3@pci0:111:0:1:        class=0x020000 card=0x005815b3 chip=0x101d15b3 rev=0x00 hdr=0x00

Similarly, the NIC hardware details and drive firmware versions can be view as follows:

# mlxfwmanager
Querying Mellanox devices firmware ...

Device #1:
----------

  Device Type:      ConnectX6DX
  Part Number:      0F6FXM_08P2T2_Ax
  Description:      Mellanox ConnectX-6 Dx Dual Port 100 GbE QSFP56 Network Adapter
  PSID:             DEL0000000027
  PCI Device Name:  pci0:23:0:0
  Base GUID:        a088c20300052a3c
  Base MAC:         a088c2052a3c
  Versions:         Current        Available
     FW             22.36.1010     N/A
     PXE            3.6.0901       N/A
     UEFI           14.29.0014     N/A

  Status:           No matching image found

Device #2:
----------

  Device Type:      ConnectX6DX
  Part Number:      0F6FXM_08P2T2_Ax
  Description:      Mellanox ConnectX-6 Dx Dual Port 100 GbE QSFP56 Network Adapter
  PSID:             DEL0000000027
  PCI Device Name:  pci0:111:0:0
  Base GUID:        a088c2030005194c
  Base MAC:         a088c205194c
  Versions:         Current        Available
     FW             22.36.1010     N/A
     PXE            3.6.0901       N/A
     UEFI           14.29.0014     N/A

  Status:           No matching image found

Compared with its F900 predecessor, the F910 sees a number of hardware performance upgrades. These include a move to PCI Gen5, Gen 4 NVMe, DDR5 memory, Sapphire Rapids CPU, and a new software-defined persistent memory file system journal ((SPDM). Also the 1GbE management port has moved to Lan-On-Motherboard (LOM), whereas the DB9 serial port is now on a RIO card. Firmware-wise, the F910 and OneFS 9.8 require a minimum of NFP 12.0.

In terms of performance, the new F910 provides a considerable leg up on the previous generation F900. This is particularly apparent with NFSv3 streaming writes, as can be seen here:

OneFS node compatibility provides the ability to have similar node types and generations within the same node pool. In OneFS 9.8 and later, compatibility between the F910 nodes and the previous generation F900 platform is supported.

Component F900 F910
Platform R740 R760
Drives 24 x 2.5” NVMe SSD 24 x 2.5” NVMe SSD
CPU Intel Xeon 6240R (Cascade Lake) 2.4GHz, 24C Intel Xeon 6442Y (Sapphire Rapids) 2.6GHz, 24C
Memory 736GB DDR4 512GB DDR5

This compatibility facilitates the addition of individual F910 nodes to an existing node pool comprising three of more F900s if desired, rather than creating a F910 new node.

In compatibility mode with F900 nodes containing the 1.92TB drive option, the F910’s 3.84TB drives will be short stroke formatted, resulting in a 1.92TB capacity per drive.​ Also note that, while the F910 is node pool compatible with the F900, a performance degradation is experienced where the F910 is effectively throttled to match the performance envelope of the F900s. ​

PowerScale All-flash F910 Debut

Building on the success of the recent PowerScale F710 and F210 and OneFS 9.8 releases comes the widely anticipated launch of the new high-end PowerScale F-series hardware platform. This new F910 all-flash node adds significant density, capacity, and horsepower to the PowerScale all-flash family.

Based on the latest generation of Dell’s PowerEdge R760 platform, the F910 boasts a range of Gen4 NVMe SSD capacities, paired with a Sapphire Rapids CPU, a generous helping of DDR5 memory, and PCI Gen5 100GbE front and back-end network connectivity – all housed within a compact, power-efficient 2RU form factor chassis.

Here’s where these new nodes sit in the current hardware hierarchy:

This new F910 node will supersede the F900, rounding out the all-flash platform refresh, and further extending PowerScale’s price-performance and price-density envelopes.

The PowerScale F910 node offers a substantial hardware evolution from the previous generation, while also focusing on environmental sustainability, reducing power consumption and carbon footprint. Housed in a 2RU ‘Smart Flow’ chassis for balanced airflow and enhanced cooling, the F910 offers twenty four NVMe drives with 3.85 TB or 7.68 TB TLC and 15.36 TB or 31 TB QLC SSD options.

The F910 also includes in-line compression and deduplication by default, further increasing its capacity headroom and effective density. Plus, using Intel’s 4th gen Xeon ‘Sapphire Rapids’ CPUs results in 19% lower cycles-per-instruction, while PCIe Gen 5 quadruples throughput over Gen 3, and the latest DDR5 DRAM offers greater speed and bandwidth – all netting up to 90% higher performance per watt. Additionally, like the F710 and F210, the new F910 includes the new 32 GB Software Defined Persistent Memory (SDPM) file system journal, in place of NVDIMM-n in prior platforms, thereby saving a DIMM slot on the motherboard too.

On the OneFS side, the recently launched 9.8 release delivers a dramatic performance bump – particularly for the all-flash platforms. OneFS 9.8 benefits from latency-improving sharding and parallel thread handling enhancements to its locking infrastructure and protocol heads – on top of the ‘direct write’ non-cached IO boost that 9.7 delivered for the all-flash NVMe platforms.

This combination of generational hardware upgrades plus OneFS software advancements results in dramatic performance gains for the F910 – particularly for streaming reads and writes, which see a 2x or greater improvement over the prior F900 platform. This makes the F910 an ideal candidate for demanding workloads such as M&E content creation and rendering, high concurrency and low latency HPC workloads such as chip design (EDA), high frequency trading, and all phases of generative AI workflows, etc.

Scalability-wise, the F910 requires a minimum of three nodes to form a cluster (or node pool), with up to a maximum of 252 nodes, and the basic specs for the new platform includes:

Component PowerScale F910
CPU Dual–socket Intel Sapphire Rapids, 2.6GHz, 24C
Memory 512GB DDR5 DRAM
SSDs per node 24 x NVMe SSDs
Raw capacities per node 92TB to 737TB
Drive options 3.84TB, 7.68TB TLC and 15.36TB, 30.72TB QLC
Front-end network 2 x 100GbE or 25GbE
Back-end network 2 x 100 GbE

Note that the F910 also has node compatibility with its predecessor and can therefore coexist with legacy F900s within the same node pool.

In the next article, we’ll dig into the technical details of the new platform. But, in summary, when combined with OneFS 9.8, the new PowerScale all-flash F910 platform quite simply delivers on density, efficiency, flexibility, performance, scalability, and value!

OneFS SmartLog Configuration and Management

As we saw in the previous article, OneFS 9.8 introduces new SmartLog functionality to help simply and streamline PowerScale’s issue investigation and time to resolution. SmartLog optimizes the log gathering process, while also integrating with OneFS health-checking, and CELOG events and alerting. Specifically:

Activity Description
Gather • Scope of gathers can be limited by specifying one or more functional groups.

• Extends time-based gather functionality (both shorthand, ex. 2h, and timestamp)

• Allows for gathering of small and highly optimized gathers

Healthcheck • Gathers can be triggered via ‘isi healthcheck evaluations gather’ CLI command.

• Healthcheck gathers cannot be triggered for passing evaluations

CELOG • Gathers can now be triggered via `isi event groups gather `

• CELOG gathers can only be triggered for Critical and Emergency events

In addition to the OneFS command line options in support of this new functionality, the WebUI diagnostics section has also seen a significant overhaul. This can be accessed by navigating to Cluster management > Diagnostics > Gather logs.

A gather can be easily started either by clicking the WebUI ‘Start Gather’ button below:

Or via the following CLI command:

# isi diagnostics gather start

Gather started.

Finished gathers can be found in: /ifs/data/Isilon_Support/pkg

The WebUI status monitor indicates when a gather is currently underway:

Or via the CLI:

# isi diagnostics gather status

Gather is running.

Finished gathers can be found in: /ifs/data/Isilon_Support/pkg

A running gather can also be easily terminated, either by clicking the ‘Stop Gather’ button:

Or via the following CLI command:

# isi diagnostics gather stop

Gather stopped.

When complete, SmartLog writes its gather tarfile to the /ifs/data/Isilon_Support/pkg/ directory by default. These gather files can be identified by their ‘IsilonLogs’ prefix. For example:

# ls -lsia /ifs/data/Isilon_Support/pkg/IsilonLogs*

6952453633 3124592 -rw-r--r--     1 ese  ese  2838789143 May  1 16:26 /ifs/data/Isilon_Support/pkg/IsilonLogs-HAL-9000-New1-20240501-162000-b8b6755a-eb48-467d-a5e3-3f6f650ae0d1.tgz

Note that the WebUI will display a warning recommendation to download gather log tarfiles great than 20MB in size via CLI, rather than using the WebUI option. For example:

When done, the gather file can be easily removed via the WebUI ‘Delete’ Actions button above, and successful deletion is confirmed:

The ‘Gather settings’ WebUI page remains largely unchanged in OneFS 9.8, with the choice of both a full or incremental gather, and the auto upload and various transport protocol options available:

Successful changes to the gather settings, in this case to incremental gather mode, are confirmed by a WebUI popup:

With SmartLog in OneFS 9.8, the three new options for initiating a more granular gather now include:

Gather Option Description CLI syntax
Group Gather based on the feature group(s). Ie: protocol, data service, auth, security, cloud, etc. isi_gather_info –group  <g1,g2,…,gn>
Time interval Past Gather based on duration. Time Range specified as interval (hours, days, weeks). isi_gather_info –gather-past <nw/nd/nh>
Timestamp Gather based on the beginning timestamp. isi_gather_info –gather-begin <YYYY-MM-DD [HH:MM]>

Gather based on the timestamp.

The WebUI ‘Start Gather’ page’s ‘Time Range’ option allows timestamp-based log gathers to be specified:

Timestamp-based gathers can also be initiated from the CLI with the following syntax:

# isi diagnostics gather start --gather-begin <YYYY-MM-DD [HH:MM]>

Past Gather based on duration.

Similarly, the  ‘Gather Past’ option on the WebUI ‘Start Gather’ page allows past duration log gathers to be specified:

Past-duration-based gathers can also be initiated from the CLI with the following syntax:

# isi diagnostics gather start --gather-past <nw/nd/nh>

Gather based on the feature group.

Upon initiating a gather via the WebUI, when the ‘Gather Group’ mode is selected, the full array of feature groups are displayed:

The full list of valid gather feature groups can also be displayed with the following CLI command:

# isi diagnostics gather groups

Valid components are 'abr, acct, acct_sensitive, admin, antivirus, application, auth, backup, bootmessages, celog, cloud, cloudpools, cluster, datamover, eth_backend, firmware, fs, hardware, hdfs, http, ib, iceage, job_engine, logs, messages, ndmp, network, nfs, node, performance, protocol, quotas, s3, security, smartpools, smb, snapshots, storage, synciq, usage'

For the more curious among us, the ‘isi_gather_info -l’ CLI command will list all the gather commands that SmartLog can run, plus also indicate which feature group(s) each command is a member of. For example:

# isi_gather_info -l | more

Known commands are listed by name first with important attributes nested under the commands name.

    brand_data:

        full_command_text=`cd /etc && tar -c -f /ifs/data/Isilon_Support/2024-05-02T16:47:52.717194/brand_data.tar brand`

        timeout=`300`

        is_default=True

    isi_gconfig:

        full_command_text=`/usr/bin/isi_gconfig`

        timeout=`150`

        is_default=True

        groups=[auth, celog, cloudpools, fs, hdfs, job_engine, nfs, protocol, s3, smb]

    isi_fputil_leds:

        full_command_text=`/usr/bin/isi_hwtools/isi_fputil -g`

        timeout=`150`

        is_default=True

        groups=[hardware]

    upgrade_local:

        full_command_text=`cd / && tar -c -f /ifs/data/Isilon_Support/2024-05-02T16:47:52.717194/upgrade_local.tar --exclude '/var/ifs/upgrade/AgentPersistent.db*' var/ifs/upgrade`

        timeout=`150`

        is_default=True

        groups=[admin]

    efs.lbm.drive_space:

        full_command_text=`/sbin/sysctl efs.lbm.drive_space`

        timeout=`150`

        is_default=True

        groups=[usage]

< snip >

The desired feature group(s) can be selected by clicking on their associated checkbox and then using the right arrow button to add them to the active groups column. In the following example, NFS, network, S3 and SMB have been selected, and the clicking the ‘Start Gather’ button will activate the job:

Similarly, the corresponding selected feature groups gather can be initiated from the CLI as follows:

# isi diagnostics gather start --group nfs,network,s3,smb

Gather started.

Finished gathers can be found in: /ifs/data/Isilon_Support/pkg

As of OneFS 9.5 and later, the ‘Edit gather settings’ page defaults to FTPS as the transport, with the associated radio buttons and text boxes for its configuration. These settings can also be viewed and/or modified via the CLI:

# isi diagnostics gather settings view

                Upload: Yes

                  ESRS: Yes

         Supportassist: Yes

           Gather Mode: full

  HTTP Insecure Upload: No

      HTTP Upload Host:

      HTTP Upload Path:

     HTTP Upload Proxy:

HTTP Upload Proxy Port: -

            Ftp Upload: Yes

       Ftp Upload Host: ftp.isilon.com

       Ftp Upload Path: /incoming

      Ftp Upload Proxy:

 Ftp Upload Proxy Port: -

       Ftp Upload User: anonymous

   Ftp Upload Ssl Cert:

   Ftp Upload Insecure: No

                 Group:

          Gather Begin:

           Gather Past:

While FTPS is the default and (highly) recommended transport, the legacy plaintext FTP upload method is still available, if necessary. As such, Dell’s log server, ftp.isilon.com, also supports both encrypted FTPS and plaintext FTP, so will not impact older (pre-OneFS 9.5) release FTP log upload behavior.

However, a warning is displayed if cluster admin elects to continue using non-secure FTP as the transport for the SmartLog:

Similarly from the CLI, if the ‘—ftp-upload-insecure’ option is configured, the following message is displayed, informing the user that plain text FTP upload is being used, and that the connection and data stream will not be encrypted:

# isi diagnostics gather start --ftp-upload-insecure

You are performing plain text FTP logs upload.

This feature is deprecated and will be removed

in a future release. Please consider the possibility

of using FTPS for logs upload. For further information,

please contact PowerScale support

...

Once a logfile gather arrives at Dell, it is automatically unpacked by a support process and analyzed using the ‘logviewer’ tool.

Note that the ‘isi diagnostics gather’ is a limited scope wrapper for the underlying ‘isi_gather_info’ utility. For example, the following two CLI commands can be used interchangeably:

# isi diagnostics gather start --group nfs,network,s3,smb

Or:

# isi_gather_info --group nfs,network,s3,smb

For reference, the comprehensive ‘isi_gather_info’ CLI utility in OneFS 9.8 includes the following options:

Option Description
–upload <boolean> Enable gather upload.
–esrs <boolean> Use ESRS for gather upload.
–noesrs Do not attempt to upload via ESRS.
–supportassist Attempt SupportAssist upload.
–nosupportassist Do not attempt to upload via SupportAssist.
–gather-mode (incremental | full) Type of gather: incremental, or full.
–gather-begin <YYYY-MM-DD [HH:MM]> Time to begin the gather.
–gather-past <nw/nd/nh> How far in the past to gather logs.
–group <g1,g2,…,gn> Which feature group(s) to gather logs for.
–http-insecure <boolean> Enable insecure HTTP upload on completed gather.
–http -host <string> HTTP Host to use for HTTP upload.
–http -path <string> Path on HTTP server to use for HTTP upload.
–http -proxy <string> Proxy server to use for HTTP upload.
–http -proxy-port <integer> Proxy server port to use for HTTP upload.
–ftp <boolean> Enable FTP upload on completed gather.
–noftp Do not attempt FTP upload.
–set-ftp-password Interactively specify alternate password for FTP.
–ftp -host <string> FTP host to use for FTP upload.
–ftp -path <string> Path on FTP server to use for FTP upload.
–ftp-port <string> Specifies alternate FTP port for upload.
–ftp-proxy <string> Proxy server to use for FTP upload.
–ftp -proxy-port <integer> Proxy server port to use for FTP upload.
–ftp-mode <value> Mode of FTP file transfer. Valid values are: both, active, passive
–ftp -user <string> FTP user to use for FTP upload.
–ftp-pass <string> Specify alternative password for FTP.
–ftp -ssl-cert <string> Specifies the SSL certificate to use in FTPS connection.
–ftp-upload-insecure <boolean> Whether to attempt a plain text FTP upload.
–ftp-upload-pass <string> FTP user to use for FTP upload password.
–set-ftp-upload-pass Specify the FTP upload password interactively.


HealthCheck Enhancements

Failing HealthCheck evaluations also now support small gathers in OneFS 9.8. HealthCheck evaluation gathers are automatically sent to Dell Support, per the cluster’s SmartLog transport configuration (‘isi diagnostics gather settings’):

From the CLI, the corresponding healthcheck gather syntax is as follows:

# isi healthcheck evaluations gather --id <evaluation id>

Note that for dark sites with no external routing, SmartLog also offers the ability to download the log gather locally:

CELOG Enhancements

CELOG event groups also support SmartLog small gathers in OneFS 9.8. However, the event severity must be either Emergency or Critical severity for the gather option to be available. For example:

Additionally, the corresponding CELOG event group gather CLI syntax is as follows:

# isi event group gather --id <event group id>

Similar to healthchecks, SmartLog also offers the ability to download the log gather locally for dark sites with no external routing:

OneFS SmartLog

Within OneFS, diagnostics gathering, either via the WebUI interface or directly using ‘isi_gather_info’ CLI utility, is the primary method for collecting and uploading a PowerScale cluster’s configuration and context. The output package is typically used help Dell Support identify and resolve bugs and issues. OneFS diagnostics gathers operate by:

  • Executing multiple commands, scripts, and utilities on a cluster, and saving their results.
  • Collating (gathering) all these files into a single ‘gzipped’ package.
  • Optionally transmitting this log gather package back to Dell via a choice of transport methods.

As part of the ongoing drive to simply and streamline PowerScale’s issue investigation and time to resolution, OneFS 9.8 introduces a new SmartLog enhancement. SmartLog refines the log gathering process, and integrates it with OneFS health-checking, and events and alerting as follows:

Activity Description
Gather • Scope of gathers can be limited by specifying one or more functional groups.

• Extends time-based gather functionality (both shorthand, ex. 2h, and timestamp)

• Allows for gathering of small and highly optimized gathers

Healthcheck • Gathers can be triggered via ‘isi healthcheck evaluations gather’ CLI command.

• Healthcheck gathers cannot be triggered for passing evaluations

CELOG • Gathers can now be triggered via `isi event groups gather `

• CELOG gathers can only be triggered for Critical and Emergency events

By default, a log gather tarfile is written to the /ifs/data/Isilon_Support/pkg/ directory. Prior to OneFS 9.8, this was an all-or-nothing operation. However, with 9.8 and SmartLog, the size and scope of this log set can be granularly controlled, both by time period or functional group. These groups span functional areas such as core OneFS protocols, data services, job engine, cloud, performance, security, authentication, networking, hardware, etc. One or many of these groups can be selected to concentrate a log gather on the area of investigation. Similarly, the desired time period can also be used to constrain the scope of a gather.

Once coalesced and zipped, a log gather can also be automatically uploaded to Dell via the following means:

Upload Mechanism Description TCP Port OneFS Release Support
SupportAssist / ESRS Uses Dell Secure Remote Support (SRS) for gather upload. 443/8443 Any
FTP Use FTP to upload completed gather. 21 Any
FTPS Use SSH-based encrypted FTPS to upload gather. 22 Default in OneFS 9.5 and later
HTTP Use HTTP to upload gather. 80/443 Any

Clearly, the ability to narrow the scope of a gather can drastically reduce the quantity of data generated and time taken to upload to Dell Support.

As indicated in the table above, FTPS is the current default option for FTP upload, thereby protecting the upload of cluster configuration and logs with an encrypted transmission session.

Under the hood, the log gather process comprises an eight phase workflow, with transmission comprising the penultimate ‘upload’ phase:

The details of each phase are as follows:

Phase Description
1.       Setup Reads from the arguments passed in, as well as any config files on disk, and sets up the config dictionary. Most of the code for this step is contained in isilon/lib/python/gather/igi_config/configuration.py. This is also the step where the program is most likely to exit, if some config arguments end up being invalid.
2.       Run local Executes all the cluster commands, which are run on the same node that is starting the gather. All these commands run in parallel (up to the current parallelism value). This is typically the second longest running phase.
3.       Run nodes Executes the node commands across all of the cluster’s nodes. This runs on each node, and while these commands run in parallel (up to the current parallelism value), they do not run in parallel with the local step.
4.       Collect Ensures all of the results end up on the overlord node (the node that started gather). If gather is using /ifs, it is very fast, but if it’s not, it needs to SCP all the node results to a single node.
5.       Generate Extra Files Generates nodes_info and package_info.xml. These are two files that are present in every single gather, and tell us some important metadata about the cluster
6.       Packing Packs (tars and gzips) all the results. This is typically the longest running phase, often by an order of magnitude
7.       Upload Transports the tarfile package to its specified destination via SupportAssist, ESRS, FTPS, FTP, HTTP, etc. Depending on the geographic location, this phase might also be a lengthy duration.
8.       Cleanup Cleanups any intermediary files that were created on cluster. This phase will run even if gather fails, or is interrupted.

Since SmartLog and its underlying isi_gather_info tool is primarily intended for troubleshooting clusters with issues, it runs as root (or compadmin in compliance mode), as it needs to be able to execute under degraded conditions (eg. without GMP, during upgrade, and under cluster splits, etc). Given these atypical requirements, isi_gather_info is built as a stand-alone utility, rather than using the platform API for data collection.

While FTPS is the default and (highly) recommend transport, the legacy plaintext FTP upload method is still available, if necessary. As such, Dell’s log server, ftp.isilon.com, also supports both encrypted FTPS and plaintext FTP, so will not impact older (pre-OneFS 9.5) release FTP log upload behavior.

However, a warning is displayed if cluster admin elects to continue using non-secure FTP as the transport for the SmartLog:

Similarly from the CLI, if the ‘–ftp-insecure’ option is configured, the following message is displayed, informing the user that plain text FTP upload is being used, and that the connection and data stream will not be encrypted:

# isi_gather_info --ftp-insecure

You are performing plain text FTP logs upload.

This feature is deprecated and will be removed

in a future release. Please consider the possibility

of using FTPS for logs upload. For further information,

please contact PowerScale support

...

Once a logfile gather arrives at Dell, it is automatically unpacked by a support process and analyzed using the ‘logviewer’ tool.

In the next article in this series, we’ll take a look at the various SmartLog configuration options available in OneFS 9.8 that can be used to target the focus of a log gather.

OneFS Job Engine Smartthrottling – Configuration and Management

In this article we’ll dig into the details of configuring and managing SmartThrottling.

SmartThrottling intelligently prioritizes primary client traffic, while automatically using any spare resources for cluster housekeeping. It does this by dynamically throttling jobs forward and backward, yielding enhanced impact policy effectiveness, and improved predictability for cluster maintenance and data management tasks.

The read and write latencies of critical client protocol load are monitored, and SmartThrottling uses these metrics to keep the latencies within specified thresholds. As they approach the limit, the Job Engine stops increasing its work, and if latency exceeds the thresholds, it actively reduces the amount of work the jobs perform.

SmartThrottling also monitors the cluster’s drives and similarly maintains disk IO health within set limits. The actual job impact configuration remains unchanged in OneFS 9.8, and each job still has the same default level and priority as in prior releases.

Currently disabled by default on installation or upgrade to OneFS 9.8, SmartThrottling is currently recommended specifically for clusters that have experienced challenges related to the impact the Job Engine has on their workloads. For these environments, SmartThrottling should provide some noticeable improvements. However, like all 1.0 features, SmartThrottling does have some important caveats and limitations to be aware of in OneFS 9.8.

First, the SmartThrottling thresholds are currently global, so they treat all nodes equally. This means that lower powered nodes like the A-series might get impacted more than desired. This is especially germane for heterogenous clusters, with a range of differing node strengths within the cluster.

Second, it is also worth noting that, as PP performs its protocol monitoring at the IRP layer in the Likewise stack, so only NFS, SMB, S3, and HDFS are included.

As such, FTP and HTTP, which don’t use Likewise, are not currently monitored by PP. So their latencies will not be considered, and the Job Engine will not notice if HTTP and FTP workloads are being impacted.

So these caveats are the main reason that SmartThrottling hasn’t been automatically enabled yet. But engineering’s plan is to make it even smarter and enable it by default in a future release.

Configuration-wise, SmartThrottling is pretty straightforward and via the CLI only, with no WebUI integration yet. The current state of throttling can be displayed with the ‘isi job settings view’ command:

# isi job settings view

  Parallel Restriper Mode: All

          Smartthrottling: False

It can also be easily enabled or disabled via a new ‘smartthrottling’ switch for ‘isi job settings modify’.

For example, to enable SmartThrottling:

# isi job settings modify --smartthrottling enable

Or to disable:

# isi job settings modify --smartthrottling disable

Running this command will cause the Job Engine to restart, temporarily pausing and resuming any running jobs, after which they will continue where they left off and run to completion as normal.

For advanced configuration, there are three main threshold options. These are:

  • Target read latency for protocol operations.
  • Target write latency thresholds for protocol operations.
  • Disk IO time in queue threshold.

These thresholds can be viewed as follows:

# isi performance settings view

                                           Top N Collections: 1024

                                Time In Queue Threshold (ms): 10.00

                         Target read latency in microseconds: 12000.0

                        Target write latency in microseconds: 12000.0

                                  Protocol Ops Limit Enabled: Yes

Medium impact job latency threshold modifier in microseconds: 12000.0

High impact job latency threshold modifier in microseconds: 24000.0

The target read and write latency thresholds default to 12 milliseconds (ms) for low impact jobs, and are the thresholds at which SmartThrottling begins to throttle the work. There are also modifiers for both medium and high impact jobs, which are set to an additional 12 ms and 24 ms respectively by default. So for medium impact jobs, throttling will start to kick in around 20 ms, and then really throttle the job engine at 24 ms. It needs to be this high in order to maintain the mean time to data loss metrics for the FlexProtect job. Similarly, for the high impact jobs throttling starts at 30 ms and ramps up at 36 ms. But currently there are no default high impact jobs, so this level would have to be configured manually for a job.

Since SmartThrottling is currently configured for average, middle-of-the-road clusters, these advanced settings allow job engine throttling to be tuned for specific customer environments, if necessary. This can be done via the ‘isi performance settings modify’ CLI command and the  following options:

# isi performance settings modify --target-protocol-read-latency-usec <int>

                          --target-protocol-write-latency-usec

                          --medium-impact-modifier-usec

                          --high-impact-modifier-usec

                          --target-disk-time-in-queue-ms

That’s pretty much it for configuration in OneFS 9.8, although engineering will likely be adding additional tunables in a future release, when job throttling is enabled by default.

In OneFS 9.8, the default SmartThrottling thresholds target average clusters. This means that the default latency thresholds are likely much higher than desired for all-flash nodes.

So F-series clusters usually respond well to setting thresholds considerably lower than 12 milliseconds. But since there’s little customer data at this point, there really aren’t any hard and fast guidelines yet, and it’ll likely require some experimentation.

The are also some idiosyncrasies and considerations to bear in mind with job throttling, particularly if a cluster become idle for a period. That is if no protocol load occurs – then the job engine will ramp up to use more resources. This means that when client protocol load does return, the job engine will be consuming more than its fair share of cluster resources. Typically, this will auto-correct itself rapidly in most circumstances. However, if A-series nodes are being used for protocol load, which is not a recommended use case for SmartThrottling, then this auto-correction may take longer than desired. This is another scenario that engineering will address before SmartThrottling becomes prime-time and enabled by default. But for now, possible interim solutions are either:

  • Moving protocol load away from archive class nodes

Or:

  • Disabling the use of SmartThrottling and letting ‘legacy’ job engine impact management continue to function, as it does in earlier OneFS versions.

Also, since a cluster has a finite quantity of resources, if it’s being pushed hard and protocol operation latency is constantly over the threshold, jobs will be throttled to their lowest limit. This is similar to the legacy job engine throttling behavior, except that it’s now using protocol operation latency instead of other metrics. The job will continue to execute but, depending on the circumstances, this may take longer than desired. Again, this is more frequently seen on the lower-powered archive class nodes. Possible solutions here include:

  • Decreasing the cluster load so protocol latency recovers.
  • Increasing the impact setting of the job so that it can run faster.
  • Or tuning the thresholds to more appropriate values for the workload.

When it comes to monitoring and investigating SmartThrottling’s antics, there are a handful of logs that are a good place to start. First, there’s a new job engine throttling job, which contains information on the current work counts, throttling decisions, and their causes. The next place to look is the partitioned performance daemon log. This daemon is responsible for monitoring the cluster and setting throttling limits, and monitoring and throttling information and errors may be reported here. It logs the current metrics it sees across the cluster, and the job throttles it calculates from them. And finally, the standard job engine logs, where information and errors are typically reported.

Log File Location Description
Throttling log /var/log/isi_job_d_throttling.log Contains information on the current worker counts, throttling decisions, and their causes.
PP log /var/log/isi_pp_d.log The partitioned performance daemon is responsible for monitoring the cluster and setting throttling limits. Monitoring and throttling information and errors may be reported here. It logs the current metrics is sees across the cluster and the job throttles it calculates from them.
Job engine log /var/log/isi_job_d.log Job and job engine information and errors may be reported here.


OneFS Job Engine SmartThrottling Architecture

Prior to SmartThrottling, the native Job Engine resource monitoring and processing framework has allowed jobs to be throttled based on both CPU and disk I/O metrics. This legacy process still operates in OneFS 9.8 when SmartThrottling is not running. The coordinator itself does not communicate directly with the worker threads, but rather with the director process, which in turn instructs a node’s manager process for a particular job to cut back threads.

For example, if the Job Engine is running a job with LOW impact and CPU utilization drops below the threshold, the worker thread count is gradually increased up to the maximum defined by the LOW impact policy threshold. If client load on the cluster suddenly spikes, the number of worker threads is gracefully decreased. The same principle applies to disk I/O, where the Job Engine throttles back in relation to both IOPS as well as the number of I/O operations waiting to be processed in any drive’s queue. Once client load has decreased again, the number of worker threads is correspondingly increased to the maximum LOW impact threshold.

Every 20 seconds, the coordinator process gathers cluster CPU and individual disk I/O load data from all the nodes across the cluster. The coordinator uses this information, in combination with the job impact configuration, to determine how many threads may run on each cluster node to service each running job. This number can be fractional, and fractional thread counts are achieved by having a thread sleep for a given percentage of each second.

Using this CPU and disk I/O load data, every 60 seconds the coordinator evaluates how busy the various nodes are and makes a job throttling decision, instructing the various Job Engine processes as to the action they need to take. This enables throttling to be sensitive to workloads in which CPU and disk I/O load metrics yield different results. Additionally, separate load thresholds are tailored to the different classes of drives used in OneFS powered clusters, including high-speed SAS drives, lower-performance SATA disks, and flash-based solid state drives (SSDs).

The Job Engine allocates a specific number of threads to each node by default, thereby controlling the impact of a workload on the cluster. If little client activity is occurring, more worker threads are spun up to allow more work, up to a predefined worker limit. For example, the worker limit for a LOW impact job might allow one or two threads per node to be allocated, a MEDIUM impact job from four to six threads, and a HIGH impact job a dozen or more. When this worker limit is reached (or before, if client load triggers impact management thresholds first), worker threads are throttled back or terminated.

For example, a node has four active threads, and the coordinator instructs it to cut back to three. The fourth thread is allowed to finish the individual work item it is currently processing, but then quietly exit, even though the task as a whole might not be finished. A restart checkpoint is taken for the exiting worker thread’s remaining work, and this task is returned to a pool of tasks requiring completion. This unassigned task is then allocated to the next worker thread that requests a work assignment, and processing continues from the restart checkpoint. This same mechanism applies in the event that multiple jobs are running simultaneously on a cluster.

In contrast to this legacy job Engine impact management process, SmartThrottling instead draws its metrics from the OneFS Partitioned Performance (PP) framework. This framework is the same telemetry source that SmartQoS uses to limit client protocol operations.

Under the hood, SmartThrottling operates as follows:

  1. First, Partitioned Performance directly monitors the cluster resource usage at the IRP layer, paying attention to the latencies of the critical client protocol load.
  2. Based on these PP metrics, the Job Engine then attempts to maintain latencies within a specified threshold.
  3. If they approach the configured upper bound, PP directs the Job Engine to stop increasing the amount of work performed.
  4. If the latencies exceed those thresholds, then the Job Engine actively reduces the amount of work performed by quiescing job worker threads as necessary.
  5. There’s also a secondary throttling mechanism for situations when no protocol load exists, to prevent the Job Engine from commandeering all the cluster resources. This backup throttling monitors the drives, just in case there’s something else going on that’s causing the disks to become overloaded – and similarly attempts to maintain disk IO health within set limits.

The SmartThrottling thresholds, and the rate of ramping up or down the amount of work, differs based on the impact setting of a specific job. The actual Job impact configuration remains unchanged from earlier releases, and can still be set to Low, Medium, or High. And each job still has the same default impact level and priority, which can be further adjusted if desired.
Note that, since the new SmartThrottling is a freshly introduced feature at this point, it is currently disabled by default in OneFS 9.8 in an abundance of caution. So it needs to be manually enabled if you want it to run.

In the next article in this series, we’ll dig into the details of configuring and managing SmartThrotting.