PowerScale F910 Platform

In this article, we’ll take a quick peek at the new PowerScale F910 hardware platform that was released last week. Here’s where this new node sits in the current hardware hierarchy:

The PowerScale F910 is the high-end all-flash platform that utilizes a dual-socket 4th gen Zeon processor with 512GB of memory and twenty four NVMe drives, all contained within a 2RU chassis. Thus, the F910 offers a generational hardware evolution, while also focusing on environmental sustainability, reducing power consumption and carbon footprint, and delivering blistering performance. This makes the F910 and ideal candidate for demanding workloads such as M&E content creation and rendering, high concurrency and low latency workloads such as chip design (EDA), high frequency trading, and all phases of generative AI workflows, etc.

An F910 cluster can comprise between 3 and 252 nodes. Inline data reduction, which incorporates compression, dedupe, and single instancing, is also included as standard to further increase the effective capacity.

The F910 is based on the 2U R760 PowerEdge server platform, with dual socket Intel Sapphire Rapids CPUs. Front-End networking options include 100/25 GbE and with 100 GbE for the Back-End network. As such, the F910’s core hardware specifications are as follows:

Attribute F910 Spec
Chassis 2RU Dell PowerEdge R760
CPU Dual socket, 24 core Intel Sapphire Rapids 6442Y @2.6GHz
Memory 512GB Dual rank DDR5 RDIMMS (16 x 32GB)
Journal 1 x 32GB SDPM
Front-end network 2 x 100GbE or 25GbE
Back-end network 2 x 100GbE
Management port LOM (LAN on motherboard)
PCI bus PCIe v5
Drives 24 x 2.5” NVMe SSDs
Power supply Dual redundant 1400W 100V-240V, 50/60Hz

These node hardware attributes can be easily viewed from the OneFS CLI via the ‘isi_hw_status’ command. Also note that, at the current time, the F910 is only available in a 512GB memory configuration.

Starting at the business end of the node, the front panel allows the user to join an F910 to a cluster and displays the node’s name once it has successfully joined:

As with all PowerScale nodes, the front panel display provides some useful current node environmentals telemetry. The ‘check’ button activates the panel and the ‘arrow’ buttons scroll to navigate, with the initial options being ‘Setup’ or View’, as below:

After selecting ‘View’, the menu presents ‘Power’ or ‘Thermal’:

Available thermal stats include BTU/hour:

Node temperature:

Air flow in cubic ft per minute (CFM):

Removing the top cover, the internal layout of the F910 chassis is as follows:

The Dell ‘Smart Flow’ chassis is specifically designed for balanced airflow, and enhanced cooling is primarily driven by four dual-fan modules. These fan modules can be easily accessed and replaced as follows:

Additionally, the redundant power supplies (PSUs) also contain their own air flow apparatus and can be easily replaced from the rear without opening the chassis. In the event of a power supply failure, the iDRAC LED on the rear panel of the node will turn orange:

Additionally, the front panel LCD display will indicate a PSU or power cable issue:

And the amber fault light on the front panel will illuminate at the end corresponding to the faulty PSU:

For storage, each PowerScale F910 node contains ten NVMe SSDs, which are currently available in the following capacities and drive styles:

Standard drive capacity SED-FIPS drive capacity SED-non-FIPS drive capacity
3.84 TB TLC 3.84 TB TLC
7.68 TB TLC 7.68 TB TLC
15.36 TB QLC Future availability 15.36 TB QLC
30.72 TB QLC Future availability 30.72 TB QLC

Note that 15.36TB and 30.72TB SED-FIPS drive options are planned for future release.

Drive subsystem-wise, the PowerScale F910 2RU chassis is fully populated with twenty four NVMe SSDs. These are housed in drive bays spread across the front of the node as follows:

The NVMe drive connectivity is across PCIe lanes, and these drives use the NVMe and NVD drivers. The NVD is a block device driver that exposes an NVMe namespace like a drive and is what most OneFS operations act upon, and each NVMe drive has a /dev/nvmeX, /dev/nvmeXnsX and /dev/nvdX device entry  and the locations are displayed as ‘bays’. Details can be queried with OneFS CLI drive utilities such as ‘isi_radish’ and ‘isi_drivenum’. For example:

# isi_drivenum

Bay  0   Unit 15     Lnum 9     Active      SN:S61DNE0N702037   /dev/nvd5

Bay  1   Unit 14     Lnum 10    Active      SN:S61DNE0N702480   /dev/nvd4

Bay  2   Unit 13     Lnum 11    Active      SN:S61DNE0N702474   /dev/nvd3

Bay  3   Unit 12     Lnum 12    Active      SN:S61DNE0N702485   /dev/nvd2

<snip>

Moving to the back of the chassis, the rear of the F910 contains the power supplies, network, and management interfaces, which are arranged as follows:

The F910 nodes are available in the following networking configurations, with a 25/100Gb ethernet front-end and 100Gb ethernet back-end:

Front-end NIC Back-end NIC F910 NIC Support
100GbE 100GbE Yes
100GbE 25GbE No
25GbE 100GbE Yes
25GbE 25GbE No

Note that, like the F710 and F210, an Infiniband backend is not supported on the F910 at the current time. Although this option will be added in due course.

These NICs and their PCI bus addresses can be determined via the ’pciconf’ CLI command, as follows:

# pciconf -l | grep mlx

mlx5_core0@pci0:23:0:0: class=0x020000 card=0x005815b3 chip=0x101d15b3 rev=0x00 hdr=0x00

mlx5_core1@pci0:23:0:1: class=0x020000 card=0x005815b3 chip=0x101d15b3 rev=0x00 hdr=0x00

mlx5_core2@pci0:111:0:0:        class=0x020000 card=0x005815b3 chip=0x101d15b3 rev=0x00 hdr=0x00

mlx5_core3@pci0:111:0:1:        class=0x020000 card=0x005815b3 chip=0x101d15b3 rev=0x00 hdr=0x00

Similarly, the NIC hardware details and drive firmware versions can be view as follows:

# mlxfwmanager
Querying Mellanox devices firmware ...

Device #1:
----------

  Device Type:      ConnectX6DX
  Part Number:      0F6FXM_08P2T2_Ax
  Description:      Mellanox ConnectX-6 Dx Dual Port 100 GbE QSFP56 Network Adapter
  PSID:             DEL0000000027
  PCI Device Name:  pci0:23:0:0
  Base GUID:        a088c20300052a3c
  Base MAC:         a088c2052a3c
  Versions:         Current        Available
     FW             22.36.1010     N/A
     PXE            3.6.0901       N/A
     UEFI           14.29.0014     N/A

  Status:           No matching image found

Device #2:
----------

  Device Type:      ConnectX6DX
  Part Number:      0F6FXM_08P2T2_Ax
  Description:      Mellanox ConnectX-6 Dx Dual Port 100 GbE QSFP56 Network Adapter
  PSID:             DEL0000000027
  PCI Device Name:  pci0:111:0:0
  Base GUID:        a088c2030005194c
  Base MAC:         a088c205194c
  Versions:         Current        Available
     FW             22.36.1010     N/A
     PXE            3.6.0901       N/A
     UEFI           14.29.0014     N/A

  Status:           No matching image found

Compared with its F900 predecessor, the F910 sees a number of hardware performance upgrades. These include a move to PCI Gen5, Gen 4 NVMe, DDR5 memory, Sapphire Rapids CPU, and a new software-defined persistent memory file system journal ((SPDM). Also the 1GbE management port has moved to Lan-On-Motherboard (LOM), whereas the DB9 serial port is now on a RIO card. Firmware-wise, the F910 and OneFS 9.8 require a minimum of NFP 12.0.

In terms of performance, the new F910 provides a considerable leg up on the previous generation F900. This is particularly apparent with NFSv3 streaming writes, as can be seen here:

OneFS node compatibility provides the ability to have similar node types and generations within the same node pool. In OneFS 9.8 and later, compatibility between the F910 nodes and the previous generation F900 platform is supported.

Component F900 F910
Platform R740 R760
Drives 24 x 2.5” NVMe SSD 24 x 2.5” NVMe SSD
CPU Intel Xeon 6240R (Cascade Lake) 2.4GHz, 24C Intel Xeon 6442Y (Sapphire Rapids) 2.6GHz, 24C
Memory 736GB DDR4 512GB DDR5

This compatibility facilitates the addition of individual F910 nodes to an existing node pool comprising three of more F900s if desired, rather than creating a F910 new node.

In compatibility mode with F900 nodes containing the 1.92TB drive option, the F910’s 3.84TB drives will be short stroke formatted, resulting in a 1.92TB capacity per drive.​ Also note that, while the F910 is node pool compatible with the F900, a performance degradation is experienced where the F910 is effectively throttled to match the performance envelope of the F900s. ​

PowerScale All-flash F910 Debut

Building on the success of the recent PowerScale F710 and F210 and OneFS 9.8 releases comes the widely anticipated launch of the new high-end PowerScale F-series hardware platform. This new F910 all-flash node adds significant density, capacity, and horsepower to the PowerScale all-flash family.

Based on the latest generation of Dell’s PowerEdge R760 platform, the F910 boasts a range of Gen4 NVMe SSD capacities, paired with a Sapphire Rapids CPU, a generous helping of DDR5 memory, and PCI Gen5 100GbE front and back-end network connectivity – all housed within a compact, power-efficient 2RU form factor chassis.

Here’s where these new nodes sit in the current hardware hierarchy:

This new F910 node will supersede the F900, rounding out the all-flash platform refresh, and further extending PowerScale’s price-performance and price-density envelopes.

The PowerScale F910 node offers a substantial hardware evolution from the previous generation, while also focusing on environmental sustainability, reducing power consumption and carbon footprint. Housed in a 2RU ‘Smart Flow’ chassis for balanced airflow and enhanced cooling, the F910 offers twenty four NVMe drives with 3.85 TB or 7.68 TB TLC and 15.36 TB or 31 TB QLC SSD options.

The F910 also includes in-line compression and deduplication by default, further increasing its capacity headroom and effective density. Plus, using Intel’s 4th gen Xeon ‘Sapphire Rapids’ CPUs results in 19% lower cycles-per-instruction, while PCIe Gen 5 quadruples throughput over Gen 3, and the latest DDR5 DRAM offers greater speed and bandwidth – all netting up to 90% higher performance per watt. Additionally, like the F710 and F210, the new F910 includes the new 32 GB Software Defined Persistent Memory (SDPM) file system journal, in place of NVDIMM-n in prior platforms, thereby saving a DIMM slot on the motherboard too.

On the OneFS side, the recently launched 9.8 release delivers a dramatic performance bump – particularly for the all-flash platforms. OneFS 9.8 benefits from latency-improving sharding and parallel thread handling enhancements to its locking infrastructure and protocol heads – on top of the ‘direct write’ non-cached IO boost that 9.7 delivered for the all-flash NVMe platforms.

This combination of generational hardware upgrades plus OneFS software advancements results in dramatic performance gains for the F910 – particularly for streaming reads and writes, which see a 2x or greater improvement over the prior F900 platform. This makes the F910 an ideal candidate for demanding workloads such as M&E content creation and rendering, high concurrency and low latency HPC workloads such as chip design (EDA), high frequency trading, and all phases of generative AI workflows, etc.

Scalability-wise, the F910 requires a minimum of three nodes to form a cluster (or node pool), with up to a maximum of 252 nodes, and the basic specs for the new platform includes:

Component PowerScale F910
CPU Dual–socket Intel Sapphire Rapids, 2.6GHz, 24C
Memory 512GB DDR5 DRAM
SSDs per node 24 x NVMe SSDs
Raw capacities per node 92TB to 737TB
Drive options 3.84TB, 7.68TB TLC and 15.36TB, 30.72TB QLC
Front-end network 2 x 100GbE or 25GbE
Back-end network 2 x 100 GbE

Note that the F910 also has node compatibility with its predecessor and can therefore coexist with legacy F900s within the same node pool.

In the next article, we’ll dig into the technical details of the new platform. But, in summary, when combined with OneFS 9.8, the new PowerScale all-flash F910 platform quite simply delivers on density, efficiency, flexibility, performance, scalability, and value!

OneFS SmartLog Configuration and Management

As we saw in the previous article, OneFS 9.8 introduces new SmartLog functionality to help simply and streamline PowerScale’s issue investigation and time to resolution. SmartLog optimizes the log gathering process, while also integrating with OneFS health-checking, and CELOG events and alerting. Specifically:

Activity Description
Gather • Scope of gathers can be limited by specifying one or more functional groups.

• Extends time-based gather functionality (both shorthand, ex. 2h, and timestamp)

• Allows for gathering of small and highly optimized gathers

Healthcheck • Gathers can be triggered via ‘isi healthcheck evaluations gather’ CLI command.

• Healthcheck gathers cannot be triggered for passing evaluations

CELOG • Gathers can now be triggered via `isi event groups gather `

• CELOG gathers can only be triggered for Critical and Emergency events

In addition to the OneFS command line options in support of this new functionality, the WebUI diagnostics section has also seen a significant overhaul. This can be accessed by navigating to Cluster management > Diagnostics > Gather logs.

A gather can be easily started either by clicking the WebUI ‘Start Gather’ button below:

Or via the following CLI command:

# isi diagnostics gather start

Gather started.

Finished gathers can be found in: /ifs/data/Isilon_Support/pkg

The WebUI status monitor indicates when a gather is currently underway:

Or via the CLI:

# isi diagnostics gather status

Gather is running.

Finished gathers can be found in: /ifs/data/Isilon_Support/pkg

A running gather can also be easily terminated, either by clicking the ‘Stop Gather’ button:

Or via the following CLI command:

# isi diagnostics gather stop

Gather stopped.

When complete, SmartLog writes its gather tarfile to the /ifs/data/Isilon_Support/pkg/ directory by default. These gather files can be identified by their ‘IsilonLogs’ prefix. For example:

# ls -lsia /ifs/data/Isilon_Support/pkg/IsilonLogs*

6952453633 3124592 -rw-r--r--     1 ese  ese  2838789143 May  1 16:26 /ifs/data/Isilon_Support/pkg/IsilonLogs-HAL-9000-New1-20240501-162000-b8b6755a-eb48-467d-a5e3-3f6f650ae0d1.tgz

Note that the WebUI will display a warning recommendation to download gather log tarfiles great than 20MB in size via CLI, rather than using the WebUI option. For example:

When done, the gather file can be easily removed via the WebUI ‘Delete’ Actions button above, and successful deletion is confirmed:

The ‘Gather settings’ WebUI page remains largely unchanged in OneFS 9.8, with the choice of both a full or incremental gather, and the auto upload and various transport protocol options available:

Successful changes to the gather settings, in this case to incremental gather mode, are confirmed by a WebUI popup:

With SmartLog in OneFS 9.8, the three new options for initiating a more granular gather now include:

Gather Option Description CLI syntax
Group Gather based on the feature group(s). Ie: protocol, data service, auth, security, cloud, etc. isi_gather_info –group  <g1,g2,…,gn>
Time interval Past Gather based on duration. Time Range specified as interval (hours, days, weeks). isi_gather_info –gather-past <nw/nd/nh>
Timestamp Gather based on the beginning timestamp. isi_gather_info –gather-begin <YYYY-MM-DD [HH:MM]>

Gather based on the timestamp.

The WebUI ‘Start Gather’ page’s ‘Time Range’ option allows timestamp-based log gathers to be specified:

Timestamp-based gathers can also be initiated from the CLI with the following syntax:

# isi diagnostics gather start --gather-begin <YYYY-MM-DD [HH:MM]>

Past Gather based on duration.

Similarly, the  ‘Gather Past’ option on the WebUI ‘Start Gather’ page allows past duration log gathers to be specified:

Past-duration-based gathers can also be initiated from the CLI with the following syntax:

# isi diagnostics gather start --gather-past <nw/nd/nh>

Gather based on the feature group.

Upon initiating a gather via the WebUI, when the ‘Gather Group’ mode is selected, the full array of feature groups are displayed:

The full list of valid gather feature groups can also be displayed with the following CLI command:

# isi diagnostics gather groups

Valid components are 'abr, acct, acct_sensitive, admin, antivirus, application, auth, backup, bootmessages, celog, cloud, cloudpools, cluster, datamover, eth_backend, firmware, fs, hardware, hdfs, http, ib, iceage, job_engine, logs, messages, ndmp, network, nfs, node, performance, protocol, quotas, s3, security, smartpools, smb, snapshots, storage, synciq, usage'

For the more curious among us, the ‘isi_gather_info -l’ CLI command will list all the gather commands that SmartLog can run, plus also indicate which feature group(s) each command is a member of. For example:

# isi_gather_info -l | more

Known commands are listed by name first with important attributes nested under the commands name.

    brand_data:

        full_command_text=`cd /etc && tar -c -f /ifs/data/Isilon_Support/2024-05-02T16:47:52.717194/brand_data.tar brand`

        timeout=`300`

        is_default=True

    isi_gconfig:

        full_command_text=`/usr/bin/isi_gconfig`

        timeout=`150`

        is_default=True

        groups=[auth, celog, cloudpools, fs, hdfs, job_engine, nfs, protocol, s3, smb]

    isi_fputil_leds:

        full_command_text=`/usr/bin/isi_hwtools/isi_fputil -g`

        timeout=`150`

        is_default=True

        groups=[hardware]

    upgrade_local:

        full_command_text=`cd / && tar -c -f /ifs/data/Isilon_Support/2024-05-02T16:47:52.717194/upgrade_local.tar --exclude '/var/ifs/upgrade/AgentPersistent.db*' var/ifs/upgrade`

        timeout=`150`

        is_default=True

        groups=[admin]

    efs.lbm.drive_space:

        full_command_text=`/sbin/sysctl efs.lbm.drive_space`

        timeout=`150`

        is_default=True

        groups=[usage]

< snip >

The desired feature group(s) can be selected by clicking on their associated checkbox and then using the right arrow button to add them to the active groups column. In the following example, NFS, network, S3 and SMB have been selected, and the clicking the ‘Start Gather’ button will activate the job:

Similarly, the corresponding selected feature groups gather can be initiated from the CLI as follows:

# isi diagnostics gather start --group nfs,network,s3,smb

Gather started.

Finished gathers can be found in: /ifs/data/Isilon_Support/pkg

As of OneFS 9.5 and later, the ‘Edit gather settings’ page defaults to FTPS as the transport, with the associated radio buttons and text boxes for its configuration. These settings can also be viewed and/or modified via the CLI:

# isi diagnostics gather settings view

                Upload: Yes

                  ESRS: Yes

         Supportassist: Yes

           Gather Mode: full

  HTTP Insecure Upload: No

      HTTP Upload Host:

      HTTP Upload Path:

     HTTP Upload Proxy:

HTTP Upload Proxy Port: -

            Ftp Upload: Yes

       Ftp Upload Host: ftp.isilon.com

       Ftp Upload Path: /incoming

      Ftp Upload Proxy:

 Ftp Upload Proxy Port: -

       Ftp Upload User: anonymous

   Ftp Upload Ssl Cert:

   Ftp Upload Insecure: No

                 Group:

          Gather Begin:

           Gather Past:

While FTPS is the default and (highly) recommended transport, the legacy plaintext FTP upload method is still available, if necessary. As such, Dell’s log server, ftp.isilon.com, also supports both encrypted FTPS and plaintext FTP, so will not impact older (pre-OneFS 9.5) release FTP log upload behavior.

However, a warning is displayed if cluster admin elects to continue using non-secure FTP as the transport for the SmartLog:

Similarly from the CLI, if the ‘—ftp-upload-insecure’ option is configured, the following message is displayed, informing the user that plain text FTP upload is being used, and that the connection and data stream will not be encrypted:

# isi diagnostics gather start --ftp-upload-insecure

You are performing plain text FTP logs upload.

This feature is deprecated and will be removed

in a future release. Please consider the possibility

of using FTPS for logs upload. For further information,

please contact PowerScale support

...

Once a logfile gather arrives at Dell, it is automatically unpacked by a support process and analyzed using the ‘logviewer’ tool.

Note that the ‘isi diagnostics gather’ is a limited scope wrapper for the underlying ‘isi_gather_info’ utility. For example, the following two CLI commands can be used interchangeably:

# isi diagnostics gather start --group nfs,network,s3,smb

Or:

# isi_gather_info --group nfs,network,s3,smb

For reference, the comprehensive ‘isi_gather_info’ CLI utility in OneFS 9.8 includes the following options:

Option Description
–upload <boolean> Enable gather upload.
–esrs <boolean> Use ESRS for gather upload.
–noesrs Do not attempt to upload via ESRS.
–supportassist Attempt SupportAssist upload.
–nosupportassist Do not attempt to upload via SupportAssist.
–gather-mode (incremental | full) Type of gather: incremental, or full.
–gather-begin <YYYY-MM-DD [HH:MM]> Time to begin the gather.
–gather-past <nw/nd/nh> How far in the past to gather logs.
–group <g1,g2,…,gn> Which feature group(s) to gather logs for.
–http-insecure <boolean> Enable insecure HTTP upload on completed gather.
–http -host <string> HTTP Host to use for HTTP upload.
–http -path <string> Path on HTTP server to use for HTTP upload.
–http -proxy <string> Proxy server to use for HTTP upload.
–http -proxy-port <integer> Proxy server port to use for HTTP upload.
–ftp <boolean> Enable FTP upload on completed gather.
–noftp Do not attempt FTP upload.
–set-ftp-password Interactively specify alternate password for FTP.
–ftp -host <string> FTP host to use for FTP upload.
–ftp -path <string> Path on FTP server to use for FTP upload.
–ftp-port <string> Specifies alternate FTP port for upload.
–ftp-proxy <string> Proxy server to use for FTP upload.
–ftp -proxy-port <integer> Proxy server port to use for FTP upload.
–ftp-mode <value> Mode of FTP file transfer. Valid values are: both, active, passive
–ftp -user <string> FTP user to use for FTP upload.
–ftp-pass <string> Specify alternative password for FTP.
–ftp -ssl-cert <string> Specifies the SSL certificate to use in FTPS connection.
–ftp-upload-insecure <boolean> Whether to attempt a plain text FTP upload.
–ftp-upload-pass <string> FTP user to use for FTP upload password.
–set-ftp-upload-pass Specify the FTP upload password interactively.


HealthCheck Enhancements

Failing HealthCheck evaluations also now support small gathers in OneFS 9.8. HealthCheck evaluation gathers are automatically sent to Dell Support, per the cluster’s SmartLog transport configuration (‘isi diagnostics gather settings’):

From the CLI, the corresponding healthcheck gather syntax is as follows:

# isi healthcheck evaluations gather --id <evaluation id>

Note that for dark sites with no external routing, SmartLog also offers the ability to download the log gather locally:

CELOG Enhancements

CELOG event groups also support SmartLog small gathers in OneFS 9.8. However, the event severity must be either Emergency or Critical severity for the gather option to be available. For example:

Additionally, the corresponding CELOG event group gather CLI syntax is as follows:

# isi event group gather --id <event group id>

Similar to healthchecks, SmartLog also offers the ability to download the log gather locally for dark sites with no external routing:

OneFS SmartLog

Within OneFS, diagnostics gathering, either via the WebUI interface or directly using ‘isi_gather_info’ CLI utility, is the primary method for collecting and uploading a PowerScale cluster’s configuration and context. The output package is typically used help Dell Support identify and resolve bugs and issues. OneFS diagnostics gathers operate by:

  • Executing multiple commands, scripts, and utilities on a cluster, and saving their results.
  • Collating (gathering) all these files into a single ‘gzipped’ package.
  • Optionally transmitting this log gather package back to Dell via a choice of transport methods.

As part of the ongoing drive to simply and streamline PowerScale’s issue investigation and time to resolution, OneFS 9.8 introduces a new SmartLog enhancement. SmartLog refines the log gathering process, and integrates it with OneFS health-checking, and events and alerting as follows:

Activity Description
Gather • Scope of gathers can be limited by specifying one or more functional groups.

• Extends time-based gather functionality (both shorthand, ex. 2h, and timestamp)

• Allows for gathering of small and highly optimized gathers

Healthcheck • Gathers can be triggered via ‘isi healthcheck evaluations gather’ CLI command.

• Healthcheck gathers cannot be triggered for passing evaluations

CELOG • Gathers can now be triggered via `isi event groups gather `

• CELOG gathers can only be triggered for Critical and Emergency events

By default, a log gather tarfile is written to the /ifs/data/Isilon_Support/pkg/ directory. Prior to OneFS 9.8, this was an all-or-nothing operation. However, with 9.8 and SmartLog, the size and scope of this log set can be granularly controlled, both by time period or functional group. These groups span functional areas such as core OneFS protocols, data services, job engine, cloud, performance, security, authentication, networking, hardware, etc. One or many of these groups can be selected to concentrate a log gather on the area of investigation. Similarly, the desired time period can also be used to constrain the scope of a gather.

Once coalesced and zipped, a log gather can also be automatically uploaded to Dell via the following means:

Upload Mechanism Description TCP Port OneFS Release Support
SupportAssist / ESRS Uses Dell Secure Remote Support (SRS) for gather upload. 443/8443 Any
FTP Use FTP to upload completed gather. 21 Any
FTPS Use SSH-based encrypted FTPS to upload gather. 22 Default in OneFS 9.5 and later
HTTP Use HTTP to upload gather. 80/443 Any

Clearly, the ability to narrow the scope of a gather can drastically reduce the quantity of data generated and time taken to upload to Dell Support.

As indicated in the table above, FTPS is the current default option for FTP upload, thereby protecting the upload of cluster configuration and logs with an encrypted transmission session.

Under the hood, the log gather process comprises an eight phase workflow, with transmission comprising the penultimate ‘upload’ phase:

The details of each phase are as follows:

Phase Description
1.       Setup Reads from the arguments passed in, as well as any config files on disk, and sets up the config dictionary. Most of the code for this step is contained in isilon/lib/python/gather/igi_config/configuration.py. This is also the step where the program is most likely to exit, if some config arguments end up being invalid.
2.       Run local Executes all the cluster commands, which are run on the same node that is starting the gather. All these commands run in parallel (up to the current parallelism value). This is typically the second longest running phase.
3.       Run nodes Executes the node commands across all of the cluster’s nodes. This runs on each node, and while these commands run in parallel (up to the current parallelism value), they do not run in parallel with the local step.
4.       Collect Ensures all of the results end up on the overlord node (the node that started gather). If gather is using /ifs, it is very fast, but if it’s not, it needs to SCP all the node results to a single node.
5.       Generate Extra Files Generates nodes_info and package_info.xml. These are two files that are present in every single gather, and tell us some important metadata about the cluster
6.       Packing Packs (tars and gzips) all the results. This is typically the longest running phase, often by an order of magnitude
7.       Upload Transports the tarfile package to its specified destination via SupportAssist, ESRS, FTPS, FTP, HTTP, etc. Depending on the geographic location, this phase might also be a lengthy duration.
8.       Cleanup Cleanups any intermediary files that were created on cluster. This phase will run even if gather fails, or is interrupted.

Since SmartLog and its underlying isi_gather_info tool is primarily intended for troubleshooting clusters with issues, it runs as root (or compadmin in compliance mode), as it needs to be able to execute under degraded conditions (eg. without GMP, during upgrade, and under cluster splits, etc). Given these atypical requirements, isi_gather_info is built as a stand-alone utility, rather than using the platform API for data collection.
While FTPS is the default and (highly) recommend transport, the legacy plaintext FTP upload method is still available, if necessary. As such, Dell’s log server, ftp.isilon.com, also supports both encrypted FTPS and plaintext FTP, so will not impact older (pre-OneFS 9.5) release FTP log upload behavior.

However, a warning is displayed if cluster admin elects to continue using non-secure FTP as the transport for the SmartLog:

Similarly from the CLI, if the ‘–ftp-insecure’ option is configured, the following message is displayed, informing the user that plain text FTP upload is being used, and that the connection and data stream will not be encrypted:

# isi_gather_info --ftp-insecure

You are performing plain text FTP logs upload.

This feature is deprecated and will be removed

in a future release. Please consider the possibility

of using FTPS for logs upload. For further information,

please contact PowerScale support

...

Once a logfile gather arrives at Dell, it is automatically unpacked by a support process and analyzed using the ‘logviewer’ tool.

In the next article in this series, we’ll take a look at the various SmartLog configuration options available in OneFS 9.8 that can be used to target the focus of a log gather.

OneFS Job Engine Smartthrottling – Configuration and Management

In this article we’ll dig into the details of configuring and managing SmartThrottling.

SmartThrottling intelligently prioritizes primary client traffic, while automatically using any spare resources for cluster housekeeping. It does this by dynamically throttling jobs forward and backward, yielding enhanced impact policy effectiveness, and improved predictability for cluster maintenance and data management tasks.

The read and write latencies of critical client protocol load are monitored, and SmartThrottling uses these metrics to keep the latencies within specified thresholds. As they approach the limit, the Job Engine stops increasing its work, and if latency exceeds the thresholds, it actively reduces the amount of work the jobs perform.

SmartThrottling also monitors the cluster’s drives and similarly maintains disk IO health within set limits. The actual job impact configuration remains unchanged in OneFS 9.8, and each job still has the same default level and priority as in prior releases.

Currently disabled by default on installation or upgrade to OneFS 9.8, SmartThrottling is currently recommended specifically for clusters that have experienced challenges related to the impact the Job Engine has on their workloads. For these environments, SmartThrottling should provide some noticeable improvements. However, like all 1.0 features, SmartThrottling does have some important caveats and limitations to be aware of in OneFS 9.8.

First, the SmartThrottling thresholds are currently global, so they treat all nodes equally. This means that lower powered nodes like the A-series might get impacted more than desired. This is especially germane for heterogenous clusters, with a range of differing node strengths within the cluster.

Second, it is also worth noting that, as PP performs its protocol monitoring at the IRP layer in the Likewise stack, so only NFS, SMB, S3, and HDFS are included.

As such, FTP and HTTP, which don’t use Likewise, are not currently monitored by PP. So their latencies will not be considered, and the Job Engine will not notice if HTTP and FTP workloads are being impacted.

So these caveats are the main reason that SmartThrottling hasn’t been automatically enabled yet. But engineering’s plan is to make it even smarter and enable it by default in a future release.

Configuration-wise, SmartThrottling is pretty straightforward and via the CLI only, with no WebUI integration yet. The current state of throttling can be displayed with the ‘isi job settings view’ command:

# isi job settings view

  Parallel Restriper Mode: All

          Smartthrottling: False

It can also be easily enabled or disabled via a new ‘smartthrottling’ switch for ‘isi job settings modify’.

For example, to enable SmartThrottling:

# isi job settings modify --smartthrottling enable

Or to disable:

# isi job settings modify --smartthrottling disable

Running this command will cause the Job Engine to restart, temporarily pausing and resuming any running jobs, after which they will continue where they left off and run to completion as normal.

For advanced configuration, there are three main threshold options. These are:

  • Target read latency for protocol operations.
  • Target write latency thresholds for protocol operations.
  • Disk IO time in queue threshold.

These thresholds can be viewed as follows:

# isi performance settings view

                                           Top N Collections: 1024

                                Time In Queue Threshold (ms): 10.00

                         Target read latency in microseconds: 12000.0

                        Target write latency in microseconds: 12000.0

                                  Protocol Ops Limit Enabled: Yes

Medium impact job latency threshold modifier in microseconds: 12000.0

High impact job latency threshold modifier in microseconds: 24000.0

The target read and write latency thresholds default to 12 milliseconds (ms) for low impact jobs, and are the thresholds at which SmartThrottling begins to throttle the work. There are also modifiers for both medium and high impact jobs, which are set to an additional 12 ms and 24 ms respectively by default. So for medium impact jobs, throttling will start to kick in around 20 ms, and then really throttle the job engine at 24 ms. It needs to be this high in order to maintain the mean time to data loss metrics for the FlexProtect job. Similarly, for the high impact jobs throttling starts at 30 ms and ramps up at 36 ms. But currently there are no default high impact jobs, so this level would have to be configured manually for a job.

Since SmartThrottling is currently configured for average, middle-of-the-road clusters, these advanced settings allow job engine throttling to be tuned for specific customer environments, if necessary. This can be done via the ‘isi performance settings modify’ CLI command and the  following options:

# isi performance settings modify --target-protocol-read-latency-usec <int>

                          --target-protocol-write-latency-usec

                          --medium-impact-modifier-usec

                          --high-impact-modifier-usec

                          --target-disk-time-in-queue-ms

That’s pretty much it for configuration in OneFS 9.8, although engineering will likely be adding additional tunables in a future release, when job throttling is enabled by default.

In OneFS 9.8, the default SmartThrottling thresholds target average clusters. This means that the default latency thresholds are likely much higher than desired for all-flash nodes.

So F-series clusters usually respond well to setting thresholds considerably lower than 12 milliseconds. But since there’s little customer data at this point, there really aren’t any hard and fast guidelines yet, and it’ll likely require some experimentation.
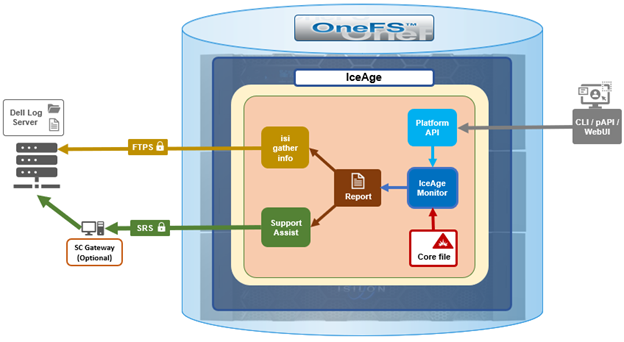
The are also some idiosyncrasies and considerations to bear in mind with job throttling, particularly if a cluster become idle for a period. That is if no protocol load occurs – then the job engine will ramp up to use more resources. This means that when client protocol load does return, the job engine will be consuming more than its fair share of cluster resources. Typically, this will auto-correct itself rapidly in most circumstances. However, if A-series nodes are being used for protocol load, which is not a recommended use case for SmartThrottling, then this auto-correction may take longer than desired. This is another scenario that engineering will address before SmartThrottling becomes prime-time and enabled by default. But for now, possible interim solutions are either:

  • Moving protocol load away from archive class nodes

Or:

  • Disabling the use of SmartThrottling and letting ‘legacy’ job engine impact management continue to function, as it does in earlier OneFS versions.

Also, since a cluster has a finite quantity of resources, if it’s being pushed hard and protocol operation latency is constantly over the threshold, jobs will be throttled to their lowest limit. This is similar to the legacy job engine throttling behavior, except that it’s now using protocol operation latency instead of other metrics. The job will continue to execute but, depending on the circumstances, this may take longer than desired. Again, this is more frequently seen on the lower-powered archive class nodes. Possible solutions here include:

  • Decreasing the cluster load so protocol latency recovers.
  • Increasing the impact setting of the job so that it can run faster.
  • Or tuning the thresholds to more appropriate values for the workload.

When it comes to monitoring and investigating SmartThrottling’s antics, there are a handful of logs that are a good place to start. First, there’s a new job engine throttling job, which contains information on the current work counts, throttling decisions, and their causes. The next place to look is the partitioned performance daemon log. This daemon is responsible for monitoring the cluster and setting throttling limits, and monitoring and throttling information and errors may be reported here. It logs the current metrics it sees across the cluster, and the job throttles it calculates from them. And finally, the standard job engine logs, where information and errors are typically reported.

Log File Location Description
Throttling log /var/log/isi_job_d_throttling.log Contains information on the current worker counts, throttling decisions, and their causes.
PP log /var/log/isi_pp_d.log The partitioned performance daemon is responsible for monitoring the cluster and setting throttling limits. Monitoring and throttling information and errors may be reported here. It logs the current metrics is sees across the cluster and the job throttles it calculates from them.
Job engine log /var/log/isi_job_d.log Job and job engine information and errors may be reported here.


OneFS Job Engine SmartThrottling Architecture

Prior to SmartThrottling, the native Job Engine resource monitoring and processing framework has allowed jobs to be throttled based on both CPU and disk I/O metrics. This legacy process still operates in OneFS 9.8 when SmartThrottling is not running. The coordinator itself does not communicate directly with the worker threads, but rather with the director process, which in turn instructs a node’s manager process for a particular job to cut back threads.

For example, if the Job Engine is running a job with LOW impact and CPU utilization drops below the threshold, the worker thread count is gradually increased up to the maximum defined by the LOW impact policy threshold. If client load on the cluster suddenly spikes, the number of worker threads is gracefully decreased. The same principle applies to disk I/O, where the Job Engine throttles back in relation to both IOPS as well as the number of I/O operations waiting to be processed in any drive’s queue. Once client load has decreased again, the number of worker threads is correspondingly increased to the maximum LOW impact threshold.

Every 20 seconds, the coordinator process gathers cluster CPU and individual disk I/O load data from all the nodes across the cluster. The coordinator uses this information, in combination with the job impact configuration, to determine how many threads may run on each cluster node to service each running job. This number can be fractional, and fractional thread counts are achieved by having a thread sleep for a given percentage of each second.

Using this CPU and disk I/O load data, every 60 seconds the coordinator evaluates how busy the various nodes are and makes a job throttling decision, instructing the various Job Engine processes as to the action they need to take. This enables throttling to be sensitive to workloads in which CPU and disk I/O load metrics yield different results. Additionally, separate load thresholds are tailored to the different classes of drives used in OneFS powered clusters, including high-speed SAS drives, lower-performance SATA disks, and flash-based solid state drives (SSDs).

The Job Engine allocates a specific number of threads to each node by default, thereby controlling the impact of a workload on the cluster. If little client activity is occurring, more worker threads are spun up to allow more work, up to a predefined worker limit. For example, the worker limit for a LOW impact job might allow one or two threads per node to be allocated, a MEDIUM impact job from four to six threads, and a HIGH impact job a dozen or more. When this worker limit is reached (or before, if client load triggers impact management thresholds first), worker threads are throttled back or terminated.

For example, a node has four active threads, and the coordinator instructs it to cut back to three. The fourth thread is allowed to finish the individual work item it is currently processing, but then quietly exit, even though the task as a whole might not be finished. A restart checkpoint is taken for the exiting worker thread’s remaining work, and this task is returned to a pool of tasks requiring completion. This unassigned task is then allocated to the next worker thread that requests a work assignment, and processing continues from the restart checkpoint. This same mechanism applies in the event that multiple jobs are running simultaneously on a cluster.

In contrast to this legacy job Engine impact management process, SmartThrottling instead draws its metrics from the OneFS Partitioned Performance (PP) framework. This framework is the same telemetry source that SmartQoS uses to limit client protocol operations.

Under the hood, SmartThrottling operates as follows:

  1. First, Partitioned Performance directly monitors the cluster resource usage at the IRP layer, paying attention to the latencies of the critical client protocol load.
  2. Based on these PP metrics, the Job Engine then attempts to maintain latencies within a specified threshold.
  3. If they approach the configured upper bound, PP directs the Job Engine to stop increasing the amount of work performed.
  4. If the latencies exceed those thresholds, then the Job Engine actively reduces the amount of work performed by quiescing job worker threads as necessary.
  5. There’s also a secondary throttling mechanism for situations when no protocol load exists, to prevent the Job Engine from commandeering all the cluster resources. This backup throttling monitors the drives, just in case there’s something else going on that’s causing the disks to become overloaded – and similarly attempts to maintain disk IO health within set limits.

The SmartThrottling thresholds, and the rate of ramping up or down the amount of work, differs based on the impact setting of a specific job. The actual Job impact configuration remains unchanged from earlier releases, and can still be set to Low, Medium, or High. And each job still has the same default impact level and priority, which can be further adjusted if desired.

Note that, since the new SmartThrottling is a freshly introduced feature at this point, it is currently disabled by default in OneFS 9.8 in an abundance of caution. So it needs to be manually enabled if you want it to run.

In the next article in this series, we’ll dig into the details of configuring and managing SmartThrotting.

OneFS Job Engine SmartThrottling

Within a PowerScale cluster, the OneFS Job Engine framework performs the background maintenance work on the cluster. It’s always there, but jobs come and go, and are run as necessary. Some of them are scheduled and executed automatically by the cluster, while others are run manually by cluster admins. Some of these jobs are very time critical like FlexProtect, who’s responsibility it is to reprotect data and help maintain and cluster’s availability and durability SLAs. Other jobs are less essential and perform general maintenance work, some optimizations, feature support, etc. And these can typically run with less criticality and a lower impact.

Some cluster administrators are blissfully unaware of the Job Engine’s existence, as it does its thing discretely behind the scenes, while others are distinctly more familiar with it.

The job engine uses the same set of resources as any clients accessing cluster. So the job engine has to manage how much CPU, memory, disk IO, etc, it uses, to avoid impinging upon client workloads. Obviously, if it consumes too much, the client loads will start to slow down and negatively impact customer productivity. The job engine manages its impact on client activity based on a set of internal disk IO and CPU metrics. But, until now, it has not paid attention to client load performance directly. So for protocol activity, the Job Engine in OneFS 9.7 and earlier does not monitor whether or not the latencies of protocol operations increase due to the jobs its running. And unfortunately, sometimes this results in client workloads being impacted more than desired. So OneFS 9.8 attempts to directly address this undesirable situation.

At its core, SmartThrottling is the Job Engine’s new automatic impact management framework.

As such, it intelligently prioritizes primary client traffic, while automatically using any spare resources for cluster housekeeping.

It does this by dynamically throttling jobs forward and backward. And this means enhanced impact policy effectiveness, and improved predictability for cluster maintenance and data management tasks.

The read and write latencies of critical client protocol load are monitored, and SmartThrottling uses these metrics to keep the latencies within specified thresholds. As they approach the limit, the Job Engine stops increasing its work, and if latency exceeds the thresholds, it actively reduces the amount of work the jobs perform.

SmartThrottling also monitors the cluster’s drives and similarly maintains disk IO health within set limits. The actual job impact configuration remains unchanged in OneFS 9.8, and each job still has the same default level and priority as in prior releases.

But before we get into the nitty gritty of SmartThrottling, first, a quick Job Engine refresher.

The OneFS Job Engine itself is based on a delegation hierarchy made up of coordinator, director, manager, and worker processes.

Once the work is initially allocated, the Job Engine uses a shared work distribution model to process the work, and a unique Job ID identifies each job. When a job is launched, whether it is scheduled, started manually, or responding to a cluster event, the Job Engine spawns a child process from the isi_job_d daemon running on each node. This Job Engine daemon is also known as the parent process.

The Job Engine’s orchestration and job execution is handled by the coordinator process. Any node can act as the coordinator, and its principal responsibilities include:

  • Monitoring workload and the constituent nodes’ status
  • Controlling the number of worker threads per node and clusterwide
  • Managing and enforcing job synchronization and checkpoints

While the individual nodes manage the actual work item allocation, the coordinator node takes control, divvies up the job, and evenly distributes the resulting tasks across the nodes in the cluster. The coordinator also periodically sends messages, through the director processes, instructing the managers to increment or decrement the number of worker threads as appropriate.

The coordinator is also responsible for starting and stopping jobs, and for processing work results as they are returned during job processing. Should it die for any reason, the coordinator responsibility automatically moves to another node.

Each node in the cluster has a Job Engine director process, which runs continuously and independently in the background. The director process is responsible for monitoring, governing, and overseeing all Job Engine activity on a particular node, constantly waiting for instruction from the coordinator to start a new job. The director process serves as a central point of contact for all the manager processes running on a node and as a liaison with the coordinator process across nodes. These responsibilities include manager process creation, delegating to and requesting work from other peers, and communicating status.

As such, the manager process is responsible for arranging the flow of tasks and task results throughout the duration of a job. The various manager processes request and exchange work with each other and supervise the worker threads assigned to them. At any time, each node in a cluster can have up to three manager processes, one for each job currently running. These managers are responsible for overseeing the flow of tasks and task results.

Each manager controls and assigns work items to multiple worker threads working on items for the designated job. Under direction from the coordinator and director, a manager process maintains the appropriate number of active threads for a configured impact level, and for the node’s current activity level. Once a job has been completed, the manager processes associated with that job, across all the nodes, are terminated. New managers are automatically spawned when the next job begins.

The manager processes on each node regularly send updates to their respective node’s director, which, in turn, informs the coordinator process of the status of the various worker tasks.

Each worker thread is given a task, if available, which it processes item-by-item until the task is complete or the manager unassigns the task. You can query the status of the nodes’ workers by running the CLI command isi job statistics view. In addition to the number of current worker threads per node, the query also provides a sleep-to-work (STW) ratio average, giving an indication of the worker thread activity level on the node.

Towards the end of a job phase, the number of active threads decreases as workers finish their allotted work and become idle. Nodes that have completed their work items remain idle, waiting for the last remaining node to finish its work allocation. When all tasks are done, the job phase is considered to be complete, and the worker threads are terminated.

As jobs are processed, the coordinator consolidates the task status from the constituent nodes and periodically writes the results to checkpoint files. These checkpoint files allow jobs to be paused and resumed, either proactively or in the event of a cluster outage. For example, if the node on which the Job Engine coordinator is running goes offline for any reason, a new coordinator automatically starts on another node. This new coordinator reads the last consistency checkpoint file, job control and task processing resume across the cluster, and no work is lost.

Each Job Engine job has an associated impact policy, dictating when a job runs and the resources that a job can consume. The default Job Engine impact policies are as follows:

Impact policy Schedule Impact level
LOW Any time of day Low
MEDIUM Any time of day Medium
HIGH Any time of day High
OFF_HOURS Outside of business hours (9 a.m. to 5 p.m., Monday to Friday), paused during business hours Low

While these default impact policies cannot be modified or deleted, additional custom impact policies can be manually created as needed.

A mix of jobs with different impact levels results in resource sharing. Each job cannot exceed the impact level set for it, and the aggregate impact level cannot exceed the highest level of the individual jobs.

In addition to the impact level, each Job Engine job also has a priority. These are based on a scale of one to ten, with a lower value signifying a higher priority. This is similar in concept to the UNIX ‘nice’ scheduling utility.

Higher-priority jobs cause lower-priority jobs to be paused. If a job is paused, it is returned to the back of the Job Engine priority queue. When the job reaches the front of the priority queue again, it resumes from where it left off. If the system schedules two jobs of the same type and priority level to run simultaneously, the job that was queued first runs first.

Priority takes effect when two or more queued jobs belong to the same exclusion set, or when, if exclusion sets are not a factor, four or more jobs are queued. The fourth queued job may be paused if it has a lower priority than the three other running jobs.

In contrast to priority, job impact policy only comes into play once a job is running and determines the resources a job can use across the cluster.

The FlexProtect, FlexProtectLIN, and IntegrityScan jobs have the highest Job Engine priority level of 1, by default. Of these, the FlexProtect jobs, having the core role of reprotecting data, are the most important.

All Job Engine job priorities are configurable by the cluster administrator. The default priority settings are strongly recommended, particularly for the highest-priority jobs.

The default impact policy and relative priority settings for the range of Job Engine jobs are as follows. Typically, the elevated impact jobs are also run at an increased priority. Note that the recommendation is to keep the default impact and priority settings, where possible, unless there is a compelling reason to change them.

Job name Impact policy Priority
AutoBalance LOW 4
AutoBalanceLIN LOW 4
AVScan LOW 6
ChangelistCreate LOW 5
Collect LOW 4
ComplianceStoreDelete LOW 6
Deduplication LOW 4
DedupeAssessment LOW 6
DomainMark LOW 5
DomainTag LOW 6
FilePolicy LOW 6
FlexProtect MEDIUM 1
FlexProtectLIN MEDIUM 1
FSAnalyze LOW 6
IndexUpdate LOW 5
IntegrityScan MEDIUM 1
MediaScan LOW 8
MultiScan LOW 4
PermissionRepair LOW 5
QuotaScan LOW 6
SetProtectPlus LOW 6
ShadowStoreDelete LOW 2
ShadowStoreProtect LOW 6
ShadowStoreRepair LOW 6
SmartPools LOW 6
SmartPoolsTree MEDIUM 5
SnapRevert LOW 5
SnapshotDelete MEDIUM 2
TreeDelete MEDIUM 4
WormQueue LOW 6

The majority of Job Engine jobs are intended to run in the background with LOW impact. Notable exceptions are the FlexProtect jobs, which by default are set at MEDIUM impact. This allows FlexProtect to quickly and efficiently reprotect data without critically affecting other user activities.

In the next article in this series, we’ll delve into the architecture and operation of SmartThrottling.

PowerScale OneFS 9.8

It’s launch season here at Dell, and PowerScale is already scaling up spring with the introduction of the innovative OneFS 9.8 release, which shipped today (9th April 2024). This new 9.8 release has something for everyone, introducing PowerScale innovations in cloud, performance, serviceability, and ease of use.

APEX File Storage for Azure

After the debut of APEX File Storage for AWS last year, OneFS 9.8 amplifies PowerScale’s presence in the public cloud by introducing APEX File Storage for Azure.

In addition to providing the same OneFS software platform on-prem and in the cloud, and customer-managed for full control, APEX File Storage for Azure in OneFS 9.8 provides linear capacity and performance scaling from four up to eighteen SSD nodes and up to 3PB per cluster. This can make it a solid fit for AI, ML and analytics applications, as well as traditional file shares and home directories, and vertical workloads like M&E, healthcare, life sciences, and financial services.

PowerScale’s scale-out architecture can be deployed on customer managed AWS and Azure infrastructure, providing the capacity and performance needed to run a variety of unstructured workflows in the public cloud.

Once in the cloud, existing PowerScale investments can be further leveraged by accessing and orchestrating your data through the platform’s multi-protocol access and APIs.

This includes the common OneFS control plane (CLI, WebUI, and platform API), and the same enterprise features: Multi-protocol, SnapshotIQ, SmartQuotas, Identity management, etc.

Simplicity and Efficiency

OneFS 9.8 SmartThrottling is an automated impact control mechanism for the job engine, allowing the cluster to automatically throttle job resource consumption if it exceeds pre-defined thresholds, in order to prioritize client workloads.

OneFS 9.8 also delivers automatic on-cluster core file analysis, and SmartLog provides an efficient, granular log file gathering and transmission framework. Both these new features help dramatically accelerate the ease and time to resolution of cluster issues.

Performance

OneFS 9.8 also adds support for Remote Direct Memory Access (RDMA) over NFS 4.1 support for applications and clients, allowing substantially higher throughput performance, especially for single connection and read intensive workloads such as machine learning and generative AI model training – while also reducing both cluster and client CPU utilization. It also provides the foundation for interoperability with NVIDIA’s GPUDirect.

RDMA over NFSv4.1 in OneFS 9.8 leverages the ROCEv2 network protocol. OneFS CLI and WebUI configuration options including global enablement, and IP pool configuration, filtering and verification of RoCEv2 capable network interfaces. NFS over RDMA is available on all PowerScale platforms containing Mellanox ConnectX network adapters on the front end, and with a choice of 25, 40, or 100 Gigabit Ethernet connectivity. The OneFS user interface helps easily identify which of a cluster’s NICs support RDMA.

Under the hood, OneFS 9.8 also introduces efficiencies such as lock sharding and parallel thread handling, delivering a substantial performance boost for streaming write heavy workloads, such as generative AI inferencing and model training. Performance scales linearly as compute is increased, keeping GPUs busy, and allowing PowerScale to easily support AI and ML workflows from small to large. Plus 9.8 also includes infrastructure support for future node hardware platform generations.

Multipath Client Driver

The addition of a new Multipath Client Driver helps expand PowerScale’s role in Dell’s strategic collaboration with NVIDIA, delivering the first and only end-to-end large scale AI system. This is based on the PowerScale F710 platform, in conjunction with PowerEdge XE9680 GPU servers, and NVIDIA’s Spectrum-X Ethernet switching platform, to optimize performance and throughput at scale.

In summary, OneFS 9.8 brings the following new features to the Dell PowerScale ecosystem:


Feature Info
Cloud ·         APEX File Storage for Azure.

·         Up to 18 SSD nodes and 3PB per cluster.

Simplicity ·         Job Engine SmartThrottling.

·         Source-based routing for IPv6 networks.

Performance ·         NFSv4.1 over RDMA.

·         Streaming write performance enhancements.

·         Infrastructure support for next generation all-flash node hardware platform.

Serviceability ·         Automatic on-cluster core file analysis.

·         SmartLog efficient, granular log file gathering.


We’ll be taking a deeper look at this new functionality in blog articles over the course of the next few weeks.

Meanwhile, the new OneFS 9.8 code is available on the Dell Online Support site, both as an upgrade and reimage file, allowing installation and upgrade of this new release.

OneFS Cluster Quorum – Part 2

The CAP theorem states that a distributed system cannot simultaneously guarantee consistency, availability, and partition tolerance. This means that, when faced with a network partition, a choice must be made between consistency and availability. OneFS does not compromise on consistency, so a mechanism is required to manage a cluster’s transient state.

In order for a cluster to properly function and accept data writes, a quorum of nodes must be active and responding. A quorum is defined as a simple majority: a cluster with N nodes must have ⌊N/2⌋+1 nodes online in order to allow writes.

OneFS uses a quorum to prevent ‘split-brain’ conditions that can be introduced if the cluster should temporarily divide into two clusters. By following the quorum rule, the architecture guarantees that regardless of how many nodes fail or come back online, if a write takes place, it can be made consistent with any previous writes that have ever taken place.

Within OneFS, quorum is a property of the group management protocol (GMP) group which helps enforce consistency across node disconnects. As we saw in the previous article, since both nodes and drives in OneFS may be readable, but not writable, OneFS actually has two quorum properties:

Read quorum is represented by ‘efs.gmp.has_quorum’ and write quorum by ‘efs.gmp.has_super_block_quorum’. For example:

# sysctl efs.gmp.has_quorum

efs.gmp.has_quorum: 1

# sysctl efs.gmp.has_super_block_quorum

efs.gmp.has_super_block_quorum: 1

The value of ‘1’ for each of the above confirms that the cluster currently has both read and write quorum respectively.

In OneFS, a group is basically a list of nodes and drives which are currently participating in the cluster. Any nodes that are not in a cluster’s main quorum group form multiple groups.. As such, the main purpose of the OneFS Group Management Protocol (GMP) is to help create and maintain a group of synchronized nodes. Having a consistent view of the cluster state is critical, since initiators need to know which node and drives are available to write to, etc.

The group of nodes with quorum is referred to as the ‘majority side’. Conversely, any node group without quorum is termed a ‘minority side’.

There can only be one majority group, but there may be multiple minority groups. A group which has one or more components in a failed state is called ‘degraded’. The degraded property is frequently used as an optimization to avoid checking the capabilities of each component. The term ‘degraded’ is also used to refer to components without their maximum capabilities.

The following table lists and describes that various terminology associated with OneFS groups and quorum.

Term Definition
Degraded A group which has one or more components in a failed state is called ‘degraded’.
Dynamic Aspect The dynamic aspect refers to the state (and health) of nodes and drives which may change.
GMP Group Management Protocol, which helps create and maintain a group of synchronized nodes. Having a consistent view of the cluster state is critical, since initiators need to know which node and drives are available to write to, etc
Group A group is a given set of nodes which have synchronized state.
Majority side A group of nodes with quorum is referred to as the ‘majority side’. By definition, there can only be one majority group.
Minority side Any group of nodes without quorum is a ‘minority side’. There may be multiple minority groups.
Quorum group A group of nodes with quorum, referred to as the ‘majority side’
Static Aspect The static aspect is the composition of the cluster, which is stored in the array.xml file.

Under normal operating conditions, every node and its disks are part of the current group, which can be shown by running sysctl efs.gmp.group on any node of the cluster. For example, the complex group output from a 93 node cluster:

# sysctl efs.gmp.group

efs.gmp.group: <d70af9> (93) :{ 1-14:0-14, 15:0-13, 16-19:0-14, 20:0-13, 21-28,30-33:0-14, 34:0-4,6-10,12-14, 35-36:0-14, 37-48:0-19, 49-60:0-14, 61-62:0-13, 63-81:0-14, 82:0-7,9-14, 83-87:0-14, 88:0-13, 89-91:0-14, 92:0-1,3-14, down: 29, soft_failed: 29, read_only: 29, smb: 1-28,30-92, nfs: 1-28,30-92, swift: 1-28,30-92, all_enabled_protocols: 1-28,30-92, isi_cbind_d: 1-28,30-92, lsass: 1-28,30-92, s3: 1-28,30-92, external_connectivity: 1-28,30-92 }

As can be seen above, protocol and external network participation is also reported, in addition to the overall state of the nodes and drives in the group,.

For more verbose output, the efs.gmp.current_info sysctl yields extensive current GMP information.

# sysctl efs.gmp.current_info

So a quorum group, as reported by GMP, consists of two parts:

Group component Description
Sequence number Provides identification for the group
Membership list Describes the group

The sequence number in the example above is:  <d70af9>

Next, the membership list shows the group members within brackets. For example, { 1-4:0-14 … } represents a four node pool, with Array IDs 1 through 4. Each node contains 15 drives, numbered zero through 14.

  • The numbers before the colon in the group membership list represent the participating Array IDs.
  • The numbers after the colon represent Drive IDs.

Note that node IDs differ from Logical Node Numbers (LNNs), the node numbers that occur within node names, and displayed by isi stat.

GMP distributes a variety of state information about nodes and drives, from identifiers to usage statistics. The most fundamental of these is the composition of the cluster, or ‘static aspect’ of the group, which is stored in the array.xml file. The array.xml file also includes info such as the ID, GUID, and whether the node is diskless or storage, plus attributes not considered part of the static aspect, such as internal IP addresses.

Similarly, the state of a node’s drives is stored in the drives.xml file, along with a flag indicating whether the drive is an SSD. Whereas GMP manages node states directly, drive states are actually managed by the ‘drv’ module, and broadcast via GMP. A significant difference between nodes and drives is that for nodes, the static aspect is distributed to every node in the array.xml file, whereas drive state is only stored locally on a node. The array.xml information is needed by every node in order to define the cluster and allow nodes to form connections. In contrast, drives.xml is only stored locally on a node. When a node goes down, other nodes have no method to obtain the drive configuration of that node. Drive information may be cached by the GMP, but it is not available if that cache is cleared.

Conversely, ‘dynamic aspect’ refers to the state of nodes and drives which may change. These states indicate the health of nodes and their drives to the various file system modules – plus whether or not components can be used for particular operations. For example, a soft-failed node or drive should not be used for new allocations. These components can be in one of seven states:

Node State Description
Dead The component is not allowed to come back to the UP state and should be removed.
Down The component is not responding.
Gone The component has been removed.
Read-only This state only applies to nodes.
Soft-failed The component is in the process of being removed.
Stalled A drive is responding slowly.
Up The component is responding.

Note that a  node or drive may go from ‘down, soft-failed’ to ‘up, soft-failed’ and back. These flags are persistently stored in the array.xml file for nodes and the drives.xml file for drives.

Group and drive state information allows the various file system modules to make timely and accurate decisions about how they should utilize nodes and drives. For example, when reading a block, the selected mirror should be on a node and drive where a read can succeed (if possible). File system modules use the GMP to test for node and drive capabilities, which include:

Capability Description
Readable Drives on this node may be read.
Restripe From Move blocks away from the node.
Writable Drives on this node may be written to.

Access levels help define ‘as a last resort’ with states for which access should be avoided unless necessary. The access levels, in order of increased access, are as follows:

Access Level Description
Modify stalled Allows writing to stalled drives.
Never Indicates a group state never supports the capability.
Normal The default access level
Read soft-fail Allows reading from soft-failed nodes and drives.
Read stalled Allows reading from stalled drives.

Drive state and node state capabilities are shown in the following tables. As shown, the only group states affected by increasing access levels are soft-failed and stalled.


Minimum Access Level for Capabilities Per Node State

Node States Readable Writeable Restripe From
UP Normal Normal No
UP, Smartfail Soft-fail Never Yes
UP, Read-only Normal Never No
UP, Smartfail, Read-only Soft-fail Never Yes
DOWN Never Never No
DOWN, Smartfail Never Never Yes
DOWN, Read-only Never Never No
DOWN, Smartfail, Read-only Never Never Yes
DEAD Never Never Yes


Minimum Access Level for Capabilities Per Drive State

Drive States Minimum Access Level to Read Minimum Access Level to Write Restripe From
UP Normal Normal No
UP, Smartfail Soft-fail Never Yes
DOWN Never Never No
DOWN, Smartfail Never Never Yes
DEAD Never Never Yes
STALLED Read_Stalled Modify_Stalled No


OneFS depends on a consistent view of a cluster’s group state. For example, some decisions, such as choosing lock coordinators, are made assuming all nodes have the same coherent notion of the cluster.

Group changes originate from multiple sources, depending on the particular state. Drive group changes are initiated by the drv module. Service group changes are initiated by processes opening and closing service devices. Each group change creates a new group ID, comprising a node ID and a group serial number. This group ID can be used to quickly determine whether a cluster’s group has changed, and is invaluable for troubleshooting cluster issues, by identifying the history of group changes across the nodes’ log files.

GMP provides coherent cluster state transitions using a process similar to two-phase commit, with the up and down states for nodes being directly managed by the GMP. RBM or Remote Block Manager code provides the communication channel that connect devices in the OneFS. When a node mounts /ifs it initializes the RBM in order to connect to the other nodes in the cluster, and uses it to exchange GMP Info, negotiate locks, and access data on the other nodes.

When a group change occurs, a cluster-wide process writes a message describing the new group membership to /var/log/messages on every node. Similarly, if a cluster ‘splits’, the newly-formed sub-clusters behave in the same way: each node records its group membership to /var/log/messages. When a cluster splits, it breaks into multiple clusters (multiple groups). This is rarely, if ever, a desirable event. A cluster is defined by its group members. Nodes or drives which lose sight of other group members no longer belong to the same group and therefore no longer belong to the same cluster.

The ‘grep’ CLI utility can be used to view group changes from one node’s perspective, by searching /var/log/messages for the expression ‘new group’. This will extract the group change statements from the logfile. The output from this command may be lengthy, so can be piped to the ‘tail’ command to limit it the desired number of lines. For example, to get the last two group changes from the local node’s  log:

# grep -i 'new group' /var/log/messages | tail -n 2

2024-03-25T16:47:22.114319+00:00 <0.4> TME1-8(id8) /boot/kernel.amd64/kernel: [gmp_info.c:2690](pid 63964="kt: gmp-drive-updat")(tid=101253) new group: <d70aac> (93) { 1-14:0-14, 15:0-13, 16-19:0-14, 20:0-13, 21-28,30-33:0-14, 34:0-4,6-10,12-14, 35-36:0-14, 37-48:0-19, 49-60:0-14, 61-62:0-13, 63-81:0-14, 82:0-7,9-14, 83-87:0-14, 88:0-13, 89-91:0-14, 92:0-1,3-14, down: 29, read_only: 29 }

2024-03-26T15:34:57.131337+00:00 <0.4> TME1-8(id8) /boot/kernel.amd64/kernel: [gmp_info.c:2690](pid 88332="kt: gmp-config")(tid=101526) new group: <d70aed> (93) { 1-14:0-14, 15:0-13, 16-19:0-14, 20:0-13, 21-28,30-33:0-14, 34:0-4,6-10,12-14, 35-36:0-14, 37-48:0-19, 49-60:0-14, 61-62:0-13, 63-81:0-14, 82:0-7,9-14, 83-87:0-14, 88:0-13, 89-91:0-14, 92:0-1,3-14, down: 29, soft_failed: 29, read_only: 29 }

OneFS and Cluster Quorum

Received a couple of recent enquires about the role and effects of cluster quorum in OneFS. So thought it might be useful to revisit this, and associated concepts, in an article.

The premise was this:

A 3 node cluster at +2d:1n or +1n protection can run fine in a degraded mode with only two active nodes and one failed node:

Given the above, shouldn’t a 4 node cluster at +2n also be able to sustain a two node failure and run fine in degraded state with two active nodes?

Spoiler alert: The answer is no, and the reason is the OneFS cluster quorum requirement.

So what’s going on here?

In order for a cluster to properly function and accept data writes, a quorum of nodes must be active and responding. A quorum is defined as a simple majority: a cluster with N nodes must have ⌊N/2⌋+1 nodes online in order to allow writes. For example, in a seven-node cluster, four nodes would be required for a quorum. If a node or group of nodes is up and responsive, but is not a member of a quorum, it runs in a read-only state.

OneFS uses a quorum to prevent ‘split-brain’ conditions that can be introduced if the cluster should temporarily divide into two clusters. By following the quorum rule, the architecture guarantees that regardless of how many nodes fail or come back online, if a write takes place, it can be made consistent with any previous writes that have ever taken place. The quorum also dictates the number of nodes required in order to move to a given data protection level. For an erasure-code-based protection-level of 𝑁+𝑀, the cluster must contain at least 2𝑀+1 nodes. For example, a minimum of five nodes is required for a +2n configuration:

This allows for a simultaneous loss of two nodes while still maintaining a quorum of three nodes for the cluster to remain fully operational.

If a cluster does drop below quorum, the file system will automatically be placed into a protected, read-only state, denying writes, but still allowing read access to the available data.

Within OneFS, quorum is a property of the group management protocol (GMP) group which helps enforce consistency across node disconnects. It is very similar to the common definition of quorum in distributed systems. It can be shown that requiring ⌊𝑁/2⌋+ 1 replicas to be available can guarantee that no updates are lost. Quorum performs this specific purpose within OneFS.

Since both nodes and drives in OneFS may be readable, but not writable, OneFS actually has two quorum properties:

Type Description
Read quorum Read quorum is defined as having ⌊𝑁/2⌋ + 1 nodes readable.
Write quorum Write quorum is defined as having at least ⌊𝑁/2⌋ + 1 nodes writable.

Under the hood, OneFS read quorum is represented by the sysctl ‘efs.gmp.has_quorum’, and write quorum by  ‘efs.gmp.has_super_block_quorum’. For example:

# sysctl efs.gmp.has_quorum

efs.gmp.has_quorum: 1

# sysctl efs.gmp.has_super_block_quorum

efs.gmp.has_super_block_quorum: 1

In the above example, the value of ‘1’ for each confirms that the cluster currently has both read and write quorum respectively.

Note that any nodes that are not in a cluster’s main quorum group form multiple groups. A group of nodes with quorum is referred to as the ‘majority side’. Similarly, any node group without quorum is termed a ‘minority side’. By definition, there can only be one majority group, but there may be multiple minority groups. A group which has one or more components in a failed state is called ‘degraded’. The degraded property is frequently used as an optimization to avoid checking the capabilities of each component. The term ‘degraded’ is also used to refer to components without their maximum capabilities.

For example, consider the earlier 4-node cluster example with a protection level of +2n and two nodes down. Even though the protection level can theoretically sustain two node failures, the minimum cluster size has been violated, hence the cluster cannot write due to lack of quorum. The following table lists various OneFS protection levels and their associated minimum cluster or pool sizes and quorum counts:

FEC Protection level Failure Tolerance Minimum Cluster/Pool Size Minimum Quorum Size
+1 Tolerate failure of 1 drive OR 1 node 3 nodes 2 nodes
+2 Tolerate failure of 2 drives OR 2 nodes 5 nodes 3 nodes
+3 Tolerate failure of 3 drives or 3 nodes 7 nodes 4 nodes
+4 Tolerate failure of 4 nodes 9 nodes 5 nodes

The OneFS Job Engine also includes a process called Collect, which acts as an orphaned block collector. If a cluster splits during a write operation, some blocks that were allocated for the file may need to be re-allocated on the quorum side. This will ‘orphan’ allocated blocks on the non-quorum side. When the cluster re-merges, the job engine’s Collect job locates these orphaned blocks through a parallelized mark-and-sweep scan and reclaims them as free space for the cluster.

File system operations typically query a GMP group several times before completing. A group may change over the course of an operation, but the operation needs a consistent view. This is provided by the group info, which is the primary interface modules use to query group state.

The efs.gmp.group sysctl can be queried to determine the current group state of a cluster. For example:

# sysctl efs.gmp.group

efs.gmp.group: <8f8f4b> (92) :{ 1-14:0-14, 15:0-13, 16-19:0-14, 20:0-13, 21-33:0-14, 34:0-4,6-10,12-14, 35-36:0-14, 37-48:0-19, 49-60:0-14, 61-62:0-13, 63-81:0-14, 82:0-7,9-14, 83-87:0-14, 88:0-13, 89-91:0-14, 92:0-1,3-14, smb: 1-92, nfs: 1-92, swift: 1-92, all_enabled_protocols: 1-92, isi_cbind_d: 1-92, lsass: 1-92, s3: 1-92, external_connectivity: 1-92 }

As shown in this large cluster example above, the output includes the GMP’s group state, but also information about services provided by nodes in the cluster. This allows nodes in the cluster to discover when services change state on other nodes and take the appropriate action when this happens. An example is SMB lock expiry, which uses GMP service information to clean up locks held by other nodes when the service owning the lock goes down.

Additional detailed current GMP state information can be gleaned from the output of the following sysctl:

# sysctl efs.gmp.current_info

Processes change the service state in GMP by opening and closing service devices. A particular service will transition from down to up in the GMP group when it opens the file descriptor for a device. Closing the service file descriptor will trigger a group change that reports the service as down. A process can explicitly close the file descriptor if it chooses, but most often the file descriptor will remain open for the duration of the process and closed automatically by the kernel when it terminates.

OneFS depends on a consistent view of a cluster’s group state. For example, in addition to read and write quorum, other decisions, such as choosing lock coordinators, are made assuming all nodes have the same coherent notion of the cluster.

As such, an understanding of OneFS quorum, groups, and their related group change messages allows you to determine the current health of a cluster – as well as reconstruct the cluster’s history when troubleshooting issues that involve cluster stability, network health, and data integrity.

Group changes originate from multiple sources, depending on the particular state. Drive group changes are initiated by the drv module. Service group changes are initiated by processes opening and closing service devices. Each group change creates a new group ID, comprising a node ID and a group serial number. This group ID can be used to quickly determine whether a cluster’s group has changed, and is invaluable for troubleshooting cluster issues, by identifying the history of group changes across the nodes’ log files.

GMP provides coherent cluster state transitions using a process similar to two-phase commit, with the up and down states for nodes being directly managed by the GMP. The Remote Block Manager (RBM)  provides the communication channel that connect devices in the OneFS. When a node mounts /ifs it initializes the RBM in order to connect to the other nodes in the cluster, and uses it to exchange GMP Info, negotiate locks, and access data on the other nodes.

Before /ifs is mounted, a ‘cluster’ is just a list of MAC and IP addresses in array.xml, managed by ibootd when nodes join or leave the cluster. When mount_efs is called, it must first determine what it‘s contributing to the file system, based on the information in drives.xml. After a cluster (re)boot, the first node to mount /ifs is immediately placed into a group on its own, with all other nodes marked down. As the Remote Block Manager (RBM) forms connections, the GMP merges the connected nodes, enlarging the group until the full cluster is represented. Group transactions where nodes transition to UP are called a ‘merge’, whereas a node transitioning to down is called a split.