OneFS SupportAssist

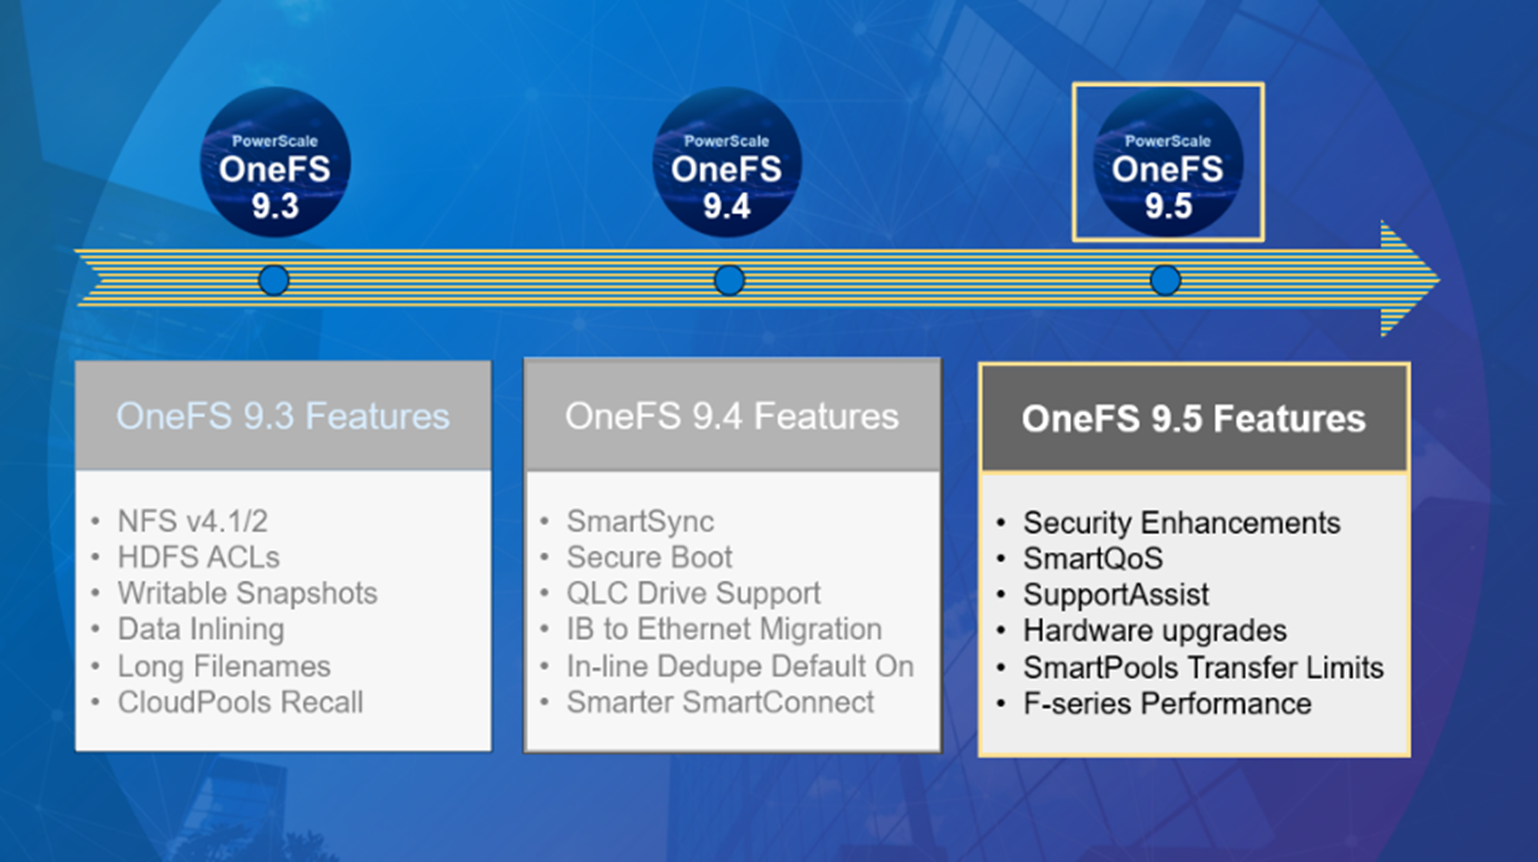
Amongst the myriad of new features that are introduced in the OneFS 9.5 release is SupportAssist, Dell’s next-gen remote connectivity system.

Dell SupportAssist helps rapidly identify, diagnose, and resolve cluster issues fast, and provides the following key benefits:

  • Improve productivity by replacing manual routines with automated support.
  • Accelerate resolution, or avoid issues completely, with predictive issue detection and proactive remediation.
  • SupportAssist is included with all support plans (features vary based on service level agreement).

Within OneFS, SupportAssist is intended for transmitting events, logs, and telemetry from PowerScale to Dell support. As such, it provides a full replacement for the legacy ESRS.

Delivering a consistent remote support experience across the Dell storage portfolio, SupportAssist is intended for all sites that can send telemetry off-cluster to Dell over the internet. SupportAssist integrates the Dell Embedded Service Enabler (ESE) into PowerScale OneFS along with a suite of daemons to allow its use on a distributed system

SupportAssist ESRS
Dell’s next generation remote connectivity solution. Being phased out of service.
Can either connect directly, or via supporting gateways. Can only use gateways for remote connectivity.
Uses Connectivity Hub to coordinate support. Uses ServiceLink to coordinate support.
Requires access key and pin, or hardware key, to enable. Uses customer username and password to enable.

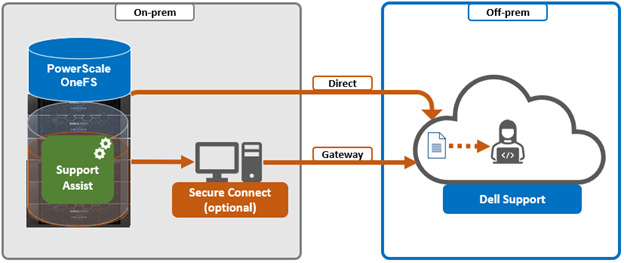
SupportAssist uses Dell Connectivity Hub and can either interact directly, or through a Secure Connect gateway.

SupportAssist comprises a variety of components that gather and transmit various pieces of OneFS data and telemetry to Dell Support, via the Embedded Service Enabler (ESE).  These workflows include CELOG events, In-product activation (IPA) information, CloudIQ telemetry data, Isi-Gather-info (IGI) logsets, and provisioning, configuration and authentication data to ESE and the various backend services.

Operation Details
Event Notification In OneFS 9.5, SupportAssist can be configured to send CELOG events and attachments via ESE to CLM.   CELOG has a ‘supportassist’ channel that, when active, will create an EVENT task for SupportAssist to propagate.
License Activation The isi license activation start command uses SupportAssist to connect.

Several pieces of PowerScale and OneFS functionality require licenses, and to register and must communicate with the Dell backend services in order to activate those cluster licenses. In OneFS 9.5, SupportAssist is the preferred mechanism to send those license activations via the Embedded Service Enabler(ESE) to the Dell backend. License information can be generated via the ‘isi license generate’ CLI command, and then activated via the ‘isi license activation start’ syntax.

Provisioning SupportAssist must register with backend services in a process known as provisioning.  This process must be executed before the Embedded Service Enabler(ESE) will respond on any of its other available API endpoints.  Provisioning can only successfully occur once per installation, and subsequent provisioning tasks will fail. SupportAssist must be configured via the CLI or WebUI before provisioning.  The provisioning process uses authentication information that was stored in the key manager upon the first boot.
Diagnostics The OneFS isi diagnostics gather and isi_gather_info logfile collation and transmission commands have a –supportassist option.
Healthchecks HealthCheck definitions are updated using SupportAssist.
Telemetry CloudIQ Telemetry data is sent using SupportAssist.
Remote Support Remote Support uses SupportAssist and the Connectivity Hub to assist customers with their clusters.

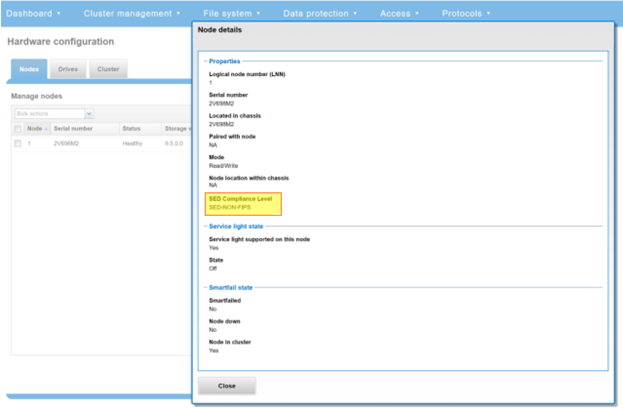
SupportAssist requires an access key and PIN, or hardware key, in order to be enabled, with most customers likely using the access key and pin method. Secure keys are held in Key manager under the RICE domain.

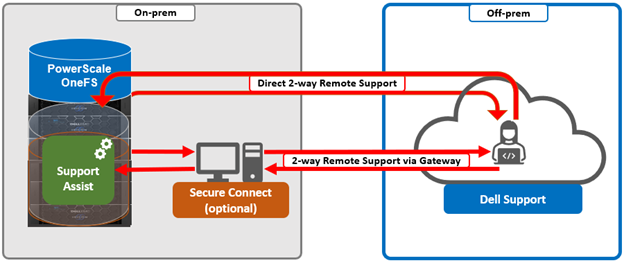
In addition to the transmission of data from the cluster to Dell, Connectivity Hub also allows inbound remote support sessions to be established for remote cluster troubleshooting.

In the next article in this series, we’ll take a deeper look at the SupportAssist architecture and operation.

OneFS SmartQoS Monitoring and Troubleshooting

The previous articles in this series have covered the SmartQoS architecture, configuration, and management. Now, we’ll turn out attention to monitoring and troubleshooting.

The ‘isi statistics workload’ CLI command can be used to monitor the dataset’s performance. The ‘Ops’ column displays the current protocol operations per second. In the following example, OPs stabilize  around 9.8, which is just below the configured limit value of 10 Ops.

# isi statistics workload --dataset ds1 & data

Similarly, this next example from the SmartQoS WebUI shows a small NFS workflow performing 497 protocol OPS in a pinned workload with a limit of 500 OPS:

Multiple paths and protocols can be pinned by selecting ‘Pin Workload’ option for a given Dataset. Here, four directory path workloads are each configured with different Protocol OPs limits:

When it comes to troubleshooting SmartQoS, there are a few areas that are worth checking right away, including the SmartQoS Ops limit configuration, isi_pp_d and isi_stats_d daemons, and the protocol service(s).

  1. For suspected Ops limit configuration issues, first confirm that the SmartQoS limits feature is enabled:
# isi performance settings view
Top N Collections: 1024
Time In Queue Threshold (ms): 10.0
Target read latency in microseconds: 12000.0
Target write latency in microseconds: 12000.0
Protocol Ops Limit Enabled: Yes

Next, verify that the workload level protocols_ops limit is correctly configured:

# isi performance workloads view <workload>

Check whether any errors are reported in the isi_tardis_d configuration log:

# cat /var/log/isi_tardis_d.log
  1. To investigating isi_pp_d, first check that the service is enabled
# isi services –a isi_pp_d

Service 'isi_pp_d' is enabled.

If necessary, the isi_pp_d service can be restarted as follows:

# isi services isi_pp_d disable

Service 'isi_pp_d' is disabled.

# isi services isi_pp_d enable

Service 'isi_pp_d' is enabled.

There’s also an isi_pp_d debug tool, which can be helpful in a pinch:

# isi_pp_d -h

Usage: isi_pp_d [-ldhs]

-l Run as a leader process; otherwise, run as a follower. Only one leader process on the cluster will be active.

-d Run in debug mode (do not daemonize).

-s Display pp_leader node (devid and lnn)

-h Display this help.

Debugging can be enabled on the isi_pp_d log file with the following command syntax:

# isi_ilog -a isi_pp_d -l debug, /var/log/isi_pp_d.log

For example, the following log snippet shows a typical isi_ppd_d.log message communication between isi_pp_d leader and isi_pp_d followers:

/ifs/.ifsvar/modules/pp/comm/SETTINGS

[090500b000000b80,08020000:0000bfddffffffff,09000100:ffbcff7cbb9779de,09000100:d8d2fee9ff9e3bfe,090001 00:0000000075f0dfdf]      

100,,,,20,1658854839  < in the format of <workload_id, cputime, disk_reads, disk_writes, protocol_ops, timestamp>

Here, the extract from the /var/log/isi_pp_d.log logfiles from nodes 1 and 2 of a cluster illustrate the different stages of Protocol Ops limit enforcement and usage:

  1. To investigate the isi_stats_d, first confirm that the isi_pp_d service is enabled:
# isi services -a isi_stats_d
Service 'isi_stats_d' is enabled.

If necessary, the isi_stats_d service can be restarted as follows:

# isi services isi_stats_d disable

# isi services isi_stats_d enable

The workload level statistics can be viewed with the following command:

# isi statistics workload list --dataset=<name>

Debugging can be enabled and on the isi_stats_d log file with the following command syntax:

# isi_stats_tool --action set_tracelevel --value debug

# cat /var/log/isi_stats_d.log
  1. To investigate protocol issues, the ‘isi services’ and ‘lwsm’ CLI commands can be useful. For example, to check the status of the S3 protocol:
# /usr/likewise/bin/lwsm list | grep -i protocol
hdfs                       [protocol]    stopped
lwswift                    [protocol]    running (lwswift: 8393)
nfs                        [protocol]    running (nfs: 8396)
s3                         [protocol]    stopped
srv                        [protocol]    running (lwio: 8096)

# /usr/likewise/bin/lwsm status s3
stopped

# /usr/likewise/bin/lwsm info s3
Service: s3
Description: S3 Server
Categories: protocol
Path: /usr/likewise/lib/lw-svcm/s3.so
Arguments:
Dependencies: lsass onefs_s3 AuditEnabled?flt_audit_s3
Container: s3

The above CLI output confirms that the S3 protocol is inactive. The S3 service can be started as follows:

# isi services -a | grep -i s3
s3                   S3 Service                               Enabled

Similarly, the S3 service can be restarted as follows:

# /usr/likewise/bin/lwsm restart s3
Stopping service: s3
Starting service: s3

To investigate further, the protocol’s log level verbosity can be increase. For example, to set the s3 log to ‘debug’:

# isi s3 log-level view
Current logging level is 'info'

# isi s3 log-level modify debug

# isi s3 log-level view
Current logging level is 'debug'

Next, view and monitor the appropriate protocol log. For example, for the S3 protocol:

# cat /var/log/s3.log

# tail -f /var/log/s3.log

Beyond the above, /var/log/messages can also be monitored for pertinent errors, since the main partition performance (PP) modules log to this file. Debug level logging can be enabled for the various PP modules as follows

Dataset:

# sysctl ilog.ifs.acct.raa.syslog=debug+ 
ilog.ifs.acct.raa.syslog: error,warning,notice (inherited) -> error,warning,notice,info,debug

Workload:

# sysctl ilog.ifs.acct.rat.syslog=debug+
ilog.ifs.acct.rat.syslog: error,warning,notice (inherited) -> error,warning,notice,info,debug

Actor work:

# sysctl ilog.ifs.acct.work.syslog=debug+
ilog.ifs.acct.work.syslog: error,warning,notice (inherited) -> error,warning,notice,info,debug

When finished, the default logging levels for the above modules can be restored as follows:

# sysctl ilog.ifs.acct.raa.syslog=notice+

# sysctl ilog.ifs.acct.rat.syslog=notice+

# sysctl ilog.ifs.acct.work.syslog=notice+

OneFS SmartQoS Configuration and Setup

In the previous article in this series, we looked at the underlying architecture and management of SmartQoS in OneFS 9.5. Next, we’ll step through an example SmartQoS configuration via the CLI and WebUI.

After an initial set up, configuring a SmartQoS protocol Ops limit comprises four fundamental steps. These are:

Step Task Description Example
1 Identify Metrics of interest Used for tracking, to enforce an Ops limit Uses ‘path and ‘protocol’ for the metrics to identify the workload.
2 Create a Dataset For tracking all of the chosen metric categories Create the dataset ‘ds1’ with the metrics identified.
3 Pin a Workload To specify exactly which values to track within the chosen metrics path: /ifs/data/client_exports

protocol: nfs3

4 Set a Limit To limit Ops based on the dataset, metrics (categories), and metric values defined by the workload Protocol_ops limit: 100


Step 1:

First, select a metric of interest. For this example we’ll use the following:

  • Protocol: NFSv3
  • Path: /ifs/test/expt_nfs

If not already present, create and verify an NFS export – in this case at /ifs/test/expt_nfs:

# isi nfs exports create /ifs/test/expt_nfs

# isi nfs exports list

ID Zone Paths Description

------------------------------------------------

1 System /ifs/test/expt_nfs

------------------------------------------------

Or from the WebUI, under Protocols UNIX sharing (NFS) > NFS exports:


Step 2:

The ‘dataset’ designation is used to categorize workload by various identification metrics including:

ID Metric Details
Username UID or SID
Primary groupname Primary GID or GSID
Secondary groupname Secondary GID or GSID
Zone name
IP address Local or remote IP address or IP address range
Path Except for S3 protocol
Share SMB share or NFS export ID
Protocol NFSv3, NFSv4, NFSoRDMA, SMB, or S3

SmartQoS in OneFS 9.5 only allows protocol OPs as the transient resources used for configuring a limit ceiling.

For example, the following CL I command can be used to create a dataset ‘ds1’, specifying protocol and path as the ID metrics:

# isi performance datasets create --name ds1 protocol path

Created new performance dataset 'ds1' with ID number 1.

Note: Resource usage tracking by ‘path’ metric is only supported by SMB and NFS.

The following command will display any configured datasets:

# isi performance datasets list

Or, from the WebUI by navigating to Cluster management > Smart QoS:


Step 3:

After the dataset has been created, a workload can be pinned to it by specifying the metric values. For example:

# isi performance workloads pin ds1 protocol:nfs3 path: /ifs/test/expt_nfs

Pinned performance dataset workload with ID number 100.

Or from the WebUI by browsing to Cluster management > Smart QoS > Pin workload:

After pinning a workload, the entry will show in the ‘Top Workloads’ section of the WebUI page. However, wait at least 30 seconds to start receiving updates.

To list all the pinned workloads from a specified dataset, use the following command:

# isi performance workloads list ds1

The prior command’s output indicates that there are currently no limits set for this workload.

By default, a protocol ops limit exists for each workload. However it is set to the maximum (the maximum value of a 64-bit unsigned integer). This is represented in the CLI output by a dash (“-“) if a limit has not been explicitly configured:

# isi performance workloads list ds1

ID   Name  Metric Values           Creation Time       Cluster Resource Impact  Client Impact  Limits

--------------------------------------------------------------------------------------

100  -     path:/ifs/test/expt_nfs 2023-02-02T12:06:05  -          -             -

           protocol:nfs3

--------------------------------------------------------------------------------------

Total: 1


Step 4:

For a pinned workload in dataset, a limit for the protocol ops limit can be configured from the CLI using the following syntax:

# isi performance workloads modify <dataset> <workload ID> --limits protocol_ops:<value>

When configuring SmartQoS, always be aware that it is a powerful performance throttling tool which can be applied to significant areas of a cluster’s data and userbase. For example, protocol OPs limits can be configured for metrics such as ‘path:/ifs’, which would affect the entire /ifs filesystem, or ‘zone_name:System’ which would limit the System access zone and all users within it. While such configurations are entirely valid, they would have a significant, system-wide impact. As such, caution should be exercised when configuring SmartQoS to avoid any inadvertent, unintended or unexpected performance constraints.

In the following example, the dataset is ‘ds1’, the workload ID is ‘100’, and the protocol OPs limit is set to value ‘10’:

# isi performance workloads modify ds1 100 --limits protocol_ops:10

protocol_ops: 18446744073709551615 -> 10

Or from the WebUI by browsing to Cluster management > Smart QoS > Pin and throttle workload:

The ‘isi performance workloads’ command can be used in ‘list’ mode to show details of the workload ‘ds1’. In this case, ‘Limits’ is set to protocol_ops = 10.

# isi performance workloads list test

ID   Name  Metric Values           Creation Time       Cluster Resource Impact  Client Impact  Limits

--------------------------------------------------------------------------------------

100  -     path:/ifs/test/expt_nfs 2023-02-02T12:06:05  -  -  protocol_ops:10

           protocol:nfs3

--------------------------------------------------------------------------------------

Total: 1

Or in ‘view’ mode:

# isi performance workloads view ds1 100

                     ID: 100

                   Name: -

          Metric Values: path:/ifs/test/expt_nfs, protocol:nfs3

          Creation Time: 2023-02-02T12:06:05

Cluster Resource Impact: -

          Client Impact: -

                 Limits: protocol_ops:10

Or from the WebUI by browsing to Cluster management > Smart QoS:

The limit value of a pinned workload can be easily modified with the following CLI syntax. For example, to set the limit to 100 OPs:

# isi performance workloads modify ds1 100 --limits protocol_ops:100

Or from the WebUI by browsing to Cluster management > Smart QoS > Edit throttle:

Similarly, the following CLI command can be used to easily remove a protocol ops limit for a pinned workload:

# isi performance workloads modify ds1 100 --no-protocol-ops-limit

Or from the WebUI by browsing to Cluster management > Smart QoS > Remove throttle:

OneFS SmartQoS Architecture and Management

The SmartQoS Protocol Ops limits architecture, introduced in OneFS 9.5, involves three primary capabilities:

  • Resource tracking
  • Resource limit distribution
  • Throttling

Under the hood, the OneFS protocol heads (NFS, SMB and S3) identify and track how many protocol operations are being processed through a specific export or share. The existing partitioned performance (PP) reporting infrastructure is leveraged for cluster wide resource usage collection, limit calculation and distribution, along with new OneFS 9.5 functionality to support pinned workload protocol Ops limits.

The protocol scheduling module (LwSched) has an inbuilt throttling capability that allows the execution of individual operations to be delayed by temporarily pausing them, or ‘sleeping’. Additionally, in OneFS 9.5, the partitioned performance kernel modules have also been enhanced to calculate ‘sleep time’ based on operation count resource information (requested, average usage etc.) – both within the current throttling window, and for a specific workload.

The fundamental SmartQoS workflow can be characterized as follows:

  1. Configuration via CLI, pAPI, or WebUI.
  2. Statistics gatherer obtains Op/s data from the partitioned performance (PP) kernel.
  3. Stats gatherer communicates Op/s data to PP leader service.
  4. Leader queries config manager for per-cluster rate limit.
  5. Leader calculates per-node limit.
  6. PP follower service is notified of per-node Op/s limit.
  7. Kernel is informed of new per-node limit.
  8. Work is scheduled with rate-limited resource.
  9. Kernel returns sleep time, if needed.

When an admin configures a per-cluster protocol Ops limit, the statistics gathering service, isi_stats_d, begins collecting workload resource information every 30 seconds by default from the partitioned performance (PP) kernel on each node in the cluster and notifies the isi_pp_d leader service of this resource info. Next, the leader gets the per-cluster protocol Ops limit plus additional resource consumption metrics from the isi_acct_cpp service via isi_tardis_d, the OneFS cluster configuration service and calculates the protocol Ops limit of each node for the next throttling window. It then instructs the isi_pp_d follower service on each node to update the kernel with the newly calculated protocol Ops limit, plus a request to reset throttling window.

Upon receipt of a scheduling request for a work item from the protocol scheduler (LwSched), the kernel calculates the required ‘sleep time’ value, based on the current node protocol Ops limit and resource usage in the current throttling window. If insufficient resources are available, the thread for work item execution thread is put to sleep for a specific interval returned from PP kernel. If resources are available, or the thread is reactivated from sleeping, it executes the work item and reports the resource usages statistics back to PP, releasing any scheduling resources it may own.

SmartQoS can be configured through either the CLI, platform API, or WebUI, and OneFS 9.5 introduces a new SmartQoS WebUI page to support this. Note that SmartQoS is only available once an upgrade to OneFS 9.5 has been committed, and any attempt to configure or run the feature prior to upgrade commit will fail with the following message:

# isi performance workloads modify DS1 -w WS1 --limits protocol_ops:50000

 Setting of protocol ops limits not available until upgrade has been committed

Once a cluster is running OneFS 9.5 and the release is committed, the SmartQoS feature is enabled by default. This, and the current configuration, can be confirmed using the following CLI command:

 # isi performance settings view

                   Top N Collections: 1024

        Time In Queue Threshold (ms): 10.0

 Target read latency in microseconds: 12000.0

Target write latency in microseconds: 12000.0

          Protocol Ops Limit Enabled: Yes

In OneFS 9.5, the ‘isi performance settings modify’ CLI command now includes a ‘protocol-ops-limit-enabled’ parameter to allow the feature to be easily disabled (or re-enabled) across the cluster. For example:

# isi performance settings modify --protocol-ops-limit-enabled false

protocol_ops_limit_enabled: True -> False

Similarly, the ‘isi performance settings view’ CLI command has been extended to report the protocol OPs limit state:

# isi performance settings view *

Top N Collections: 1024

Protocol Ops Limit Enabled: Yes

In order to set a protocol OPs limit on workload from the CLI, the ‘isi performance workload pin’ and ‘isi performance workload modify’ commands now accept an optional ‘–limits’ parameter. For example, to create a pinned workload with the ‘protocol_ops’ limit set to 10000:

# isi performance workload pin test protocol:nfs3 --limits

protocol_ops:10000

Similarly, to modify an existing workload’s ‘protocol_ops’ limit to 20000:

# isi performance workload modify test 101 --limits protocol_ops:20000

protocol_ops: 10000 -> 20000

When configuring SmartQoS, always be cognizant of the fact that it is a powerful throttling tool which can be applied to significant areas of a cluster’s data and userbase. For example, protocol OPs limits can be configured for metrics such as ‘path:/ifs’, which would affect the entire /ifs filesystem, or ‘zone_name:System’ which would limit the System access zone and all users within it.

While such configurations are entirely valid, they would have a significant, system-wide impact. As such, caution should be exercised when configuring SmartQoS to avoid any inadvertent, unintended or unexpected performance constraints.

To clear a protocol Ops limit on workload, the ‘isi performance workload’ modify CLI command has been extended to accept an optional ‘–noprotocol-ops-limit’ argument. For example:

# isi performance workload modify test 101 --no-protocol-ops-limit

protocol_ops: 20000 -> 18446744073709551615

Note that the value of ‘18446744073709551615’ in the command output above represents ‘NO_LIMIT’ set.

A workload’s protocol Ops limit can be viewed using the ‘isi performance workload list’ and ‘isi performance workload view’ CLI commands, which have been modified in OneFS 9.5 to display the limits appropriately. For example:

# isi performance workload list test

ID Name Metric Values Creation Time Impact Limits

---------------------------------------------------------------------

101 - protocol:nfs3 2023-02-02T22:35:02 - protocol_ops:20000

---------------------------------------------------------------------


# isi performance workload view test 101

ID: 101

Name: -

Metric Values: protocol:nfs3

Creation Time: 2023-02-02T22:35:02

Impact: -

Limits: protocol_ops:20000

In the next article in this series, we’ll step through an example SmartQoS configuration and verification from both the CLI and WebUI.

OneFS SmartQoS

Built atop the partitioned performance (PP) resource monitoring framework, OneFS 9.5 introduces a new SmartQoS performance management feature. SmartQoS allows a cluster administrator to set limits on the maximum number of protocol operations per second (Protocol Ops) that individual pinned workloads can consume, in order to achieve desired business workload prioritization. Among the benefits of this new QoS functionality are:

  • Enabling IT infrastructure teams to achieve performance SLAs.
  • Allowing throttling of rogue or low priority workloads and hence prioritization of other business critical workloads.
  • Helping minimize data unavailability events due to overloaded clusters.

This new SmartQoS feature in OneFS 9.5 supports the NFS, SMB and S3 protocols, including mixed traffic to the same workload.

But first, a quick refresher. The partitioned performance resource monitoring framework, which initially debuted in OneFS 8.0.1, enables OneFS to track and report the use of transient system resources (resources that only exist at a given instant), providing insight into who is consuming what resources, and how much of them. Examples include CPU time, network bandwidth, IOPS, disk accesses, and cache hits, etc.

OneFS partitioned performance is an ongoing project which, in OneFS 9.5 now provides control as well as insights. This allows control of work flowing through the system, prioritization and protection of mission critical workflows, and the ability to detect if a cluster is at capacity.

Since identification of work is highly subjective, OneFS partitioned performance resource monitoring provides significant configuration flexibility, allowing cluster admins to craft exactly how they wish to define, track, and manage workloads. For example, an administrator might want to partition their work based on criterial like which user is accessing the cluster, the export/share they are using, which IP address they’re coming from – and often a combination of all three.

OneFS has always provided client and protocol statistics, however they were typically front-end only. Similarly, OneFS provides CPU, cache and disk statistics, but they did not display who was consuming them. Partitioned performance unites these two realms, tracking the usage of the CPU, drives and caches, and spanning the initiator/participant barrier.

OneFS collects the resources consumed, grouped into distinct workloads, and the aggregation of these workloads comprise a performance dataset.

Item Description Example
Workload A set of identification metrics and resources used {username:nick, zone_name:System} consumed {cpu:1.5s, bytes_in:100K, bytes_out:50M, …}
Performance Dataset The set of identification metrics to aggregate workloads by

The list of workloads collected matching that specification

{usernames, zone_names}
Filter A method for including only workloads that match specific identification metrics. Filter{zone_name:System}

·         {username:nick, zone_name:System}

·         {username:jane, zone_name:System}

·         {username:nick, zone_name:Perf}

The following metrics are tracked by partitioned performance resource monitoring:

Category Items
Identification Metrics ·         Username / UID / SID

·         Primary Groupname / GID / GSID

·         Secondary Groupname / GID / GSID

·         Zone Name

·         Local/Remote IP Address/Range

·         Path

·         Share / Export ID

·         Protocol

·         System Name

·         Job Type

Transient Resources ·         CPU Usage

·         Bytes In/Out – Net traffic minus TCP headers

·         IOPs – Protocol OPs

·         Disk Reads – Blocks read from disk

·         Disk Writes – Block written to the journal, including protection

·         L2 Hits – Blocks read from L2 cache

·         L3 Hits – Blocks read from L3 cache

·         Latency – Sum of time taken from start to finish of OP

o   ReadLatency

o   WriteLatency

o   OtherLatency

Performance Statistics ·         Read/Write/Other Latency
Supported Protocols ·         NFS

·         SMB

·         S3

·         Jobs

·         Background Services


Be aware that, in OneFS 9.5, SmartQoS currently does not support the following Partitioned Performance criteria:

Unsupported Group Unsupported Items
Metrics •       System Name

•       Job Type

Workloads •       Top workloads (as they are dynamically and automatically generated by kernel)

•       Workloads belonging to the ‘system’ dataset

Protocols •       Jobs

•       Background services

When pinning a workload to a dataset, note that the more metrics there are in that dataset, the more parameters need to be defined when pinning to it. For example:

Dataset = zone_name, protocol, username

To set a limit on this dataset, you’d need to pin the workload by also specifying the zone name, protocol, and username.

When using the remote_address and/or local_address metrics, you can also specify a subnet. For example: 10.123.456.0/24

With the exception of the system dataset, performance datasets must be configured before statistics are collected.

For SmartQoS in OneFS 9.5, limits can be defined and configured as a maximum number of protocol operations (Protocol Ops) per second across the following protocols:

  • NFSv3
  • NFSv4
  • NFSoRDMA
  • SMB
  • S3

A Protocol Ops limit can be applied to up to 4 custom datasets. All pinned workloads within a dataset can have a limit configured, up to a maximum of 1024 workloads per dataset. If multiple workloads happen to share a common metric value with overlapping limits, the lowest limit that is configured would be enforced

Note that, on upgrading to OneFS 9.5, SmartQoS is activated only once the new release has been successfully committed.

In the next article in this series, we’ll take a deeper look at SmartQoS’ underlying architecture and workflow.

OneFS SmartPools Transfer Limits Configuration and Management

In the first article in this series, we looked at the architecture and considerations of the new OneFS 9.5’s SmartPools Transfer Limits. Now, we turn our attention to the configuration and management of this feature.

From the control plane side, OneFS 9.5 contains several WebUI and CLI enhancements to reflect the new SmartPools Transfer Limits functionality. Probably the most obvious change is in the ‘local storage usage status’ histogram, where tiers and their child nodepools have been aggregated, for a more logical grouping. Also blue limit-lines have been added above each of the storagepools, and a red warning status displayed for any pools that have exceeded the transfer limit.

Similarly, the storage pools status page now includes transfer limit details, with the 90% limit displayed for any storagepools using the default setting.

From the CLI, the ‘isi storagepool nodepools view’ command reports the transfer limit status and percentage for a pool. The used SSD and HDD bytes percentages, in the command output indicate where the pool utilization is relative to the transfer limit.

# isi storagepool nodepools view h5600_200tb_6.4tb-ssd_256gb
ID: 42
Name: h5600_200tb_6.4tb-ssd_256gb
Nodes: 77, 78, 79, 80, 81, 82, 83, 84
Node Type IDs: 10
Protection Policy: +2d:1n
Manual: No
L3 Enabled: Yes
L3 Migration Status: l3
Tier: -
Transfer Limit: 90%
Transfer Limit State: default
Usage
Avail Bytes: 1.13P
Avail SSD Bytes: 0.00
Avail HDD Bytes: 1.13P
Balanced: No
Free Bytes: 1.18P
Free SSD Bytes: 0.00
Free HDD Bytes: 1.18P
Total Bytes: 1.41P
Total SSD Bytes: 0.00
Total HDD Bytes: 1.41P
Used Bytes: 229.91T (17%)
Used SSD Bytes: 0.00 (0%)
Used HDD Bytes: 229.91T (17%)
Virtual Hot Spare Bytes: 56.94T

The storage transfer limit can be easily configured from the CLI as for either a  specific pool, as a default, or disabled, using the new –transfer-limit and –default-transfer-limit flags.

The following CLI command can be used to set the transfer limit for a specific storagepool:

# isi storagepool nodepools/tier modify --transfer-limit={0-100, default, disabled}

For example, to set a limit of 80% on an A200 nodepool:

# isi storagepool a200_30tb_1.6tb-ssd_96gb modify --transfer-limit=80

Or to set the default limit of 90% on tier ‘perf1’:

# isi storagepool perf1 --transfer-limit=default

Note that setting the transfer limit of a tier automatically applies to all its child nodepools, regardless of any prior child limit configurations.

The global ‘isi storage settings view’ CLI command output shows the default transfer limit, which is 90%, but can be configured between 0 to 100% if desired.

# isi storagepool settings view

     Automatically Manage Protection: files_at_default

Automatically Manage Io Optimization: files_at_default

Protect Directories One Level Higher: Yes

       Global Namespace Acceleration: disabled

       Virtual Hot Spare Deny Writes: Yes

        Virtual Hot Spare Hide Spare: Yes

      Virtual Hot Spare Limit Drives: 2

     Virtual Hot Spare Limit Percent: 0

             Global Spillover Target: anywhere

                   Spillover Enabled: Yes

              Default Transfer Limit: 90%

        SSD L3 Cache Default Enabled: Yes

                     SSD Qab Mirrors: one

            SSD System Btree Mirrors: one

            SSD System Delta Mirrors: one

This default limit can be reconfigured from the CLI with the following syntax::

# isi storagepool settings modify --default-transfer-limit={0-100, disabled}

For example, to set a new default transfer limit of 85%:

# isi storagepool settings modify --default-transfer-limit=85

And the same changes can be made from the SmartPools WebUI, too, by navigating to Storage pools > SmartPools settings:

Once a SmartPools job has completed in OneFS 9.5, the job report contains a new field that reports any ‘files not moved due to transfer limit exceeded’.

# isi job reports view 1056

...

...

Policy/testpolicy/Access changes skipped 0

Policy/testpolicy/ADS containers matched 'head’ 0

Policy/testpolicy/ADS containers matched 'snapshot’ 0

Policy/testpolicy/ADS streams matched 'head’ 0

Policy/testpolicy/ADS streams matched 'snapshot’ 0

Policy/testpolicy/Directories matched 'head’ 0

Policy/testpolicy/Directories matched 'snapshot’ 0

Policy/testpolicy/File creation templates matched 0

Policy/testpolicy/Files matched 'head’ 0

Policy/testpolicy/Files matched 'snapshot’ 0

Policy/testpolicy/Files not moved due to transfer limit exceeded 0 

Policy/testpolicy/Files packed 0

Policy/testpolicy/Files repacked 0

Policy/testpolicy/Files unpacked 0

Policy/testpolicy/Packing changes skipped 0

Policy/testpolicy/Protection changes skipped 0

Policy/testpolicy/Skipped files already in containers 0

Policy/testpolicy/Skipped packing non-regular files 0

Policy/testpolicy/Skipped packing regular files 0

Additionally, the ‘SYS STORAGEPOOL FILL LIMIT EXCEEDED’ alert is triggered when a storagepool’s usage has exceeded its transfer limit. Raised at the INFO level. Each hour, CELOG fires off a monitor helper script which will measure how full each storagepool is relative to its transfer limit. The usage is gathered by reading from the diskpool database, and the transfer limits are stored in gconfig. If a nodepool has a transfer limit of 50% and usage of 75%, the monitor helper will report a measurement of 150%, triggering an alert.

# isi event view 126

ID: 126

Started: 11/29 20:32

Causes Long: storagepool: vonefs_13gb_4.2gb-ssd_6gb:hdd usage: 33.4, transfer limit: 30.0

Lnn: 0

Devid: 0

Last Event: 2022-11-29T20:32:16

Ignore: No

Ignore Time: Never

Resolved: No

Resolve Time: Never

Ended: --

Events: 1

Severity: information

And from the WebUI:

And there you have it: Transfer Limits, and the first step in the evolution towards a smarter SmartPools.

OneFS SmartPools Transfer Limits

The new OneFS 9.5 release introduces the first phase of engineering’s Smarter SmartPools initiative, and delivers a new feature called SmartPools transfer limits.

The goal of SmartPools transfer limits is to address spill over. Previously, when file pool policies were executed, OneFS had no guardrails to protect against overfilling the destination or target storage pool. So if a pool was overfilled, data would unexpectedly spill over into other storage pools.

The effects of an overflow would result in storagepool usage exceeding 100%, and the SmartPools job itself doing a considerable amount of unnecessary work, trying to send files to a given storagepool. But since the pool was full, it would then have to send those files off to another storage pool that was below capacity. This would result in data going where it wasn’t intended, and the potential for individual files to end up getting split between pools. Also, if the full pool was on the most performant storage in the cluster, all subsequent newly created data would now land on slower storage, affecting its throughput and latency. The recovery from a spillover can be fairly cumbersome since it’s tough for the cluster to regain balance, and urgent system administration may be required to free space on the affected tier.

In order to address this, SmartPools Transfer Limits allows a cluster admin to configure a storagepool capacity-usage threshold, expressed as a percentage, and beyond which file pool policies stop moving data to that particular storage pool.

These transfer limits only take effect when running jobs that apply filepool policies, such as SmartPools, SmartPoolsTree, and FilePolicy.

The main benefits of this feature are two-fold:

  • Safety, in that OneFS avoids undesirable actions, so the customer is prevented from getting into escalation situations, because SmartPools won’t overfill storage pools.
  • Performance, since transfer limits avoid unnecessary work, and allow the SmartPools job to finish sooner.

Under the hood, a cluster’s storagepool SSD and HDD usage is calculated using the same algorithm as reported by the ‘isi storagepools list’ CLI command. This means that a pool’s VHS (virtual hot spare) reserved capacity is respected by SmartPools transfer limits. When a SmartPools job is running, there is at least one worker on each node processing a single LIN at any given time. In order to calculate the current HDD and SSD usage per storagepool, the worker must read from the diskpool database. To circumvent this potential bottleneck, the filepool policy algorithm caches the diskpool database contents in memory for up to 10 seconds.

Transfer limits are stored in gconfig, and a separate entry is stored within the ‘smartpools.storagepools’ hierarchy for each explicitly defined transfer limit.

Note that in the SmartPools lexicon, ‘storage pool’ is a generic term denoting either a tier or nodepool. Additionally, SmartPools tiers comprise one or more constituent nodepools.

Each gconfig transfer limit entry stores a limit value and the diskpool database identifier of the storagepool that the transfer limit applies to. Additionally, a ‘transfer limit state’ field specifies which of three states the limit is in:

Limit State Description
Default Fallback to the default transfer limit.
Disabled Ignore transfer limit.
Enabled The corresponding transfer limit value is valid.

A SmartPools transfer limit does not affect the general ingress, restriping, or reprotection of files, regardless of how full the storage pool is where that file is located.  So if you’re creating or modifying a file on the cluster, it will be created there anyway. This will continue up until the pool reaches 100% capacity, at which point it will then spill over.

The default transfer limit is 90% of a pool’s capacity, and this applies to all storage pools where the cluster admin hasn’t explicitly set a threshold. Another thing to note is that the default limit doesn’t get set until a cluster upgrade to OneFS 9.5 has been committed. So if you’re running a SmartPools policy job during an upgrade, you’ll have the preexisting behavior, which is send the file to wherever the file pool policy instructs it to go. It’s also worth noting that, even though the default transfer limit is set on commit, if a job was running over that commit edge, you’d have to pause and resume it for the new limit behavior to take effect. This is because the new configuration is loaded lazily when the job workers are started up, so even though the configuration changes, a pause and resume is needed to pick up those changes.

SmartPools itself needs to be licensed on a cluster in order for transfer limits to work. And limits can be configured at the tier or nodepool level. But if you change the limit of a tier, it automatically applies to all its child nodepools, regardless of any prior child limit configurations. The transfer limit feature can also be disabled, which results in the same spillover behavior OneFS always displayed, and any configured limits will not be respected.

Note that a filepool policy’s transfer limits algorithm does not consider the size of the file when deciding whether to move it to the policy’s target storagepool, regardless of whether the file is empty, or a large file. Similarly, a target storagepool’s usage must exceed its transfer limit before the filepool policy will stop moving data to that target pool. The assumption here is that any storagepool usage overshoot is insignificant in scale compared to the capacity of a cluster’s storagepool.

A SmartPools file pool policy allow you to send snapshot or HEAD data blocks to different targets, if so desired.

Because the transfer limit applies to the storagepool itself, and not to the file pool policy, it’s important to note that, if you’ve got varying storagepool targets and one file pool policy, you may have a situation where the head data blocks do get moved. But if the snapshot is pointing at a storage pool that has exceeded its transfer limit, it’s blocks will not be moved.

File pool policies also allow you to specify how a mixed node’s SSDs are used: Either as L3 cache, or as an SSD strategy for head and snapshot blocks. If the SSDs in a node are configured for L3, they are not being used for storage, so any transfer limits are irrelevant to it. As an alternative to L3 cache, SmartPools offers three main categories of SSD strategy:  Avoid, which means send all blocks to HDD, Data, which means send everything to SSD, and then metadata read or read-write, which send varying numbers of metadata mirrors to SSD, and data blocks to hard disk.

To reflect this, SmartPools transfer limits are slightly nuanced when it comes to SSD strategies. That is, if the storagepool target contains both HDD and SSD, the usage capacity of both mediums needs to be below the transfer limit in order for the file to be moved to that target. For example, take two node pools, NP1 and NP2.

A file pool policy, Pol1, is configured, that matches all files under /ifs/dir1, with an SSD strategy of metadata write, and pool NP1 as the target for HEAD’s data blocks. For snapshots, the target is NP2, with an ‘avoid’ SSD strategy, so just writing to hard disk for both snapshot data and metadata.

When a SmartPools job runs and attempts to apply this file pool policy, it sees that SSD usage is above the 85% configured transfer limit for NP1. So, even though the hard disk capacity usage is below the limit, neither HEAD data nor metadata will be sent to NP1.

For the snapshot, the SSD usage is also above the NP2 pool’s transfer limit of 90%.

However, since the SSD strategy is ‘avoid’, and because the hard disk usage is below the limit, the snapshot’s data and metadata get successfully sent to the NP2 HDDs.

PowerScale OneFS 9.5

Dell PowerScale is already powering up the new year with the launch of the innovative OneFS 9.5 release, which shipped today (24th January 2023).

With data integrity and protection being top of mind in this era of unprecedented corporate cyber threats, OneFS 9.5 brings an array of new security features and functionality to keep your unstructured data and workloads more secure than ever, as well as delivering significant performance gains on the PowerScale nodes – such as up to 55% higher performance on all-flash F600 and F900 nodes as compared with the previous OneFS release.[3]

Table Description automatically generated

OneFS and hardware security features

New PowerScale OneFS 9.5 security enhancements include those that help address US Federal and DoD mandates, such as FIPS 140-2, Common Criteria, and DISA STIGs – in addition to general enterprise data security requirements. Multi-factor authentication (MFA), single sign-on (SSO) support, data encryption in-flight and at rest, TLS 1.2, USGv6R1 IPv6 support, SED Master Key rekey, plus a new host-based firewall are all part of OneFS 9.5.

15TB and 30TB self-encrypting (SED) SSDs now enable PowerScale platforms running OneFS 9.5 to scale up to 186 PB of encrypted raw capacity per cluster – all within a single volume and filesystem, and before any additional compression and deduplication benefit.

Delivering federal-grade security to protect data under a zero trust model 

Security-wise, the United States Government has stringent requirements for infrastructure providers such as Dell Technologies, requiring vendors to certify that products comply with requirements such as USGv6, STIGs, DoDIN APL, and so on. Activating the OneFS 9.5 cluster hardening option implements a default maximum security configuration with AES and SHA cryptography, which automatically renders a cluster FIPS 140-2 compliant.

OneFS 9.5 introduces SAML-based single sign-on (SSO) from both the command line and WebUI using a redesigned login screen. OneFS SSO is compatible with identity providers (IDPs) such as Active Directory Federation Services, and is also multi-tenant aware, allowing independent configuration for each of a cluster’s Access Zones.

Federal APL requirements mandate that a system must validate all certificates in a chain up to a trusted CA root certificate. To address this, OneFS 9.5 introduces a common Public Key Infrastructure (PKI) library to issue, maintain, and revoke public key certificates. These certificates provide digital signature and encryption capabilities, using public key cryptography to provide identification and authentication, data integrity, and confidentiality. This PKI library is used by all OneFS components that need PKI certificate verification support, such as SecureSMTP, ensuring that they all meet Federal PKI requirements.

This new OneFS 9.5 PKI and certificate authority infrastructure enables multi-factor authentication, allowing users to swipe a CAC or PIV smartcard containing their login credentials to gain access to a cluster, rather than manually entering username and password information. Additional account policy restrictions in OneFS 9.5 automatically disable inactive accounts, provide concurrent administrative session limits, and implement a delay after a failed login.

As part of FIPS 140-2 compliance, OneFS 9.5 introduces a new key manager, providing a secure central repository for secrets such as machine passwords, Kerberos keytabs, and other credentials, with the option of using MCF (modular crypt format) with SHA256 or SHA512 hash types. OneFS protocols and services may be configured to support FIPS 140-2 data-in-flight encryption compliance, while SED clusters and the new Master Key re-key capability provide FIPS 140-2 data-at-rest encryption. Plus, any unused or non-compliant services are easily disabled.

On the network side, the Federal APL has several IPv6 (USGv6) requirements that are focused on allowing granular control of individual components of a cluster’s IPv6 stack, such as duplicate address detection (DAD) and link local IP control. Satisfying both STIG and APL requirements, the new OneFS 9.5 front-end firewall allows security admins to restrict the management interface to specified subnet and implement port blocking and packet filtering rules from the cluster’s command line or WebUI, in accordance with federal or corporate security policy.

Improving performance for the most demanding workloads

OneFS 9.5 unlocks dramatic performance gains, particularly for the all-flash NVMe platforms, where the PowerScale F900 can now support line-rate streaming reads. SmartCache enhancements allow OneFS 9.5 to deliver streaming read performance gains of up to 55% on the F-series nodes, F600 and F9003, delivering benefit to media and entertainment workloads, plus AI, machine learning, deep learning, and more.

Enhancements to SmartPools in OneFS 9.5 introduce configurable transfer limits. These limits include maximum capacity thresholds, expressed as a percentage, above which SmartPools will not attempt to move files to a particular tier, boosting both reliability and tiering performance.

Granular cluster performance control is enabled with the debut of PowerScale SmartQoS, which allows admins to configure limits on the maximum number of protocol operations that NFS, S3, SMB, or mixed protocol workloads can consume.

Enhancing enterprise-grade supportability and serviceability

OneFS 9.5 enables SupportAssist, Dell’s next generation remote connectivity system for transmitting events, logs, and telemetry from a PowerScale cluster to Dell Support. SupportAssist provides a full replacement for ESRS, as well as enabling Dell Support to perform remote diagnosis and remediation of cluster issues.

Upgrading to OneFS 9.5 

The new OneFS 9.5 code is available on the Dell Technologies Support site, as both an upgrade and reimage file, allowing both installation and upgrade of this new release.

We’ll be taking a deeper look at the new  OneFS 9.5 features and functionality in additional blog articles over the course of the next few weeks.

[1] Based on Dell analysis, August 2021.

[2] Based on Dell analysis comparing cybersecurity software capabilities offered for Dell PowerScale vs. competitive products, September 2022.

[3] Based on Dell internal testing, January 2023. Actual results will vary.

OneFS SmartQuotas Efficiency Reporting

In this final article in the OneFS SmartQuotas series we focus on data reduction and storage efficiency reporting:

SmartQuotas reports both data reduction and efficiency as a ratio across the desired dataset as specified in the quota path field. These efficiency and data reduction ratios are for the full quota directory and its contents, including any overhead, and reflects the net efficiency of both compression and deduplication.

The ‘isi quota quotas view’ CLI command provides considerably more detailed storage capacity and efficiency metrics. These include the following:

Metric Description
AppLogical The application data that can be written to the cluster, irrespective of where it’s stored from.
FSLogical Removing sparse data (data that was always sparse, was zero block eliminated, or data that’s been moved to the cloud, etc) results in filesystem logical, which is the non-sparse data stored on the filesystem.
AppPhysical Data reduction techniques, such as compression and dedupe, reduce filesystem logical to application physical, or pre-protected physical. This is the physical size application data on the filesystem disks, and does not include metadata, protection overhead, or data moved to the cloud.
FSPhysical Application physical with data protection overhead added – including inode, mirroring and FEC blocks, etc. Filesystem physical is also referred to as protected physical.
Reduction The data reduction ratio is the amount that’s been reduced from the filesystem logical down to the application physical.
Efficiency Storage efficiency ratio is the filesystem logical divided by the filesystem physical.

With OneFS, the relationship between the capacity, data reduction and storage efficiency elements is as follows:

SmartQuotas reports the capacity saving from in-line data reduction as a storage efficiency ratio across the desired data set, or quota domain, as specified in the quota path field. The efficiency ratio is for the full quota directory and its contents, including any overhead, and reflects the net efficiency of compression and deduplication. On a cluster with licensed and configured SmartQuotas, this efficiency ratio can be easily viewed from the WebUI by navigating to ‘File System > SmartQuotas > Quotas and Usage’. In OneFS 9.2 and later, in addition to the storage efficiency ratio, the data reduction ratio is also displayed.

Similarly, the same data can be accessed from the OneFS command line via is ‘isi quota quotas list’ CLI command. For example:

# isi quota quotas list Type      AppliesTo  Path  Snap  Hard  Soft  Adv  Used  Reduction  Efficiency ------------------------------------------------------------------------------ directory DEFAULT    /ifs  No    -     -     -    6.02T 2.54 : 1   1.77 : 1 ------------------------------------------------------------------------------

Total: 1

More detail, including both the physical (raw) and logical (effective) data capacities, is also available via the ‘isi quota quotas view <path> <type>’ CLI command. For example:

# isi quota quotas view /ifs directory                         Path: /ifs                         Type: directory                    Snapshots: No                     Enforced: No                    Container: No                       Linked: No                        Usage                            Files: 5759676          Physical(With Overhead): 6.93T         FSPhysical(Deduplicated): 3.41T          FSLogical(W/O Overhead): 6.02T         AppLogical(ApparentSize): 6.01T                    ShadowLogical: -                     PhysicalData: 2.01T                       Protection: 781.34G      Reduction(Logical/Data): 2.54 : 1 Efficiency(Logical/Physical): 1.77 : 1

To configure SmartQuotas for in-line data efficiency reporting, create a directory quota at the top-level file system directory of interest, for example /ifs. Creating and configuring a directory quota is a simple procedure and can be performed from the WebUI by navigate to ‘File System > SmartQuotas > Quotas and Usage’ and selecting ‘Create a Quota’. In the create pane, field, set the Quota type to ‘Directory quota’, add the preferred top-level path to report on, select ‘application logical size’ for Quota Accounting, and set the Quota Limits to ‘Track storage without specifying a storage limit’. Finally, select the ‘Create Quota’ button to confirm the configuration and activate the new directory quota.

The efficiency ratio is a single, current-in time efficiency metric that is calculated per quota directory and includes the sum of in-line compression, zero block removal, in-line dedupe and SmartDedupe. This is in contrast to a history of stats over time, as reported in the ‘isi statistics data-reduction’ CLI command output, described above. As such, the efficiency ratio for the entire quota directory will reflect what is actually there.

When using SyncIQ replication on a cluster pair that are also running SmartQuotas, the quotas are matched one-to-one across the replication set. Multiple quotas are supported within a source directory or domain structure, and the target directory is included in a quota domain.

During replication SyncIQ ignores quota limits. However, if a quota is over limit, quotas still prevent users from adding additional data. SyncIQ will never automatically delete an existing target quota. Instead, a SyncIQ will fail, as opposed to deleting an existing quota. This may occur during an initial sync where the target directory has an existing quota under it, or if a source directory is deleted that has a quota on it on the target. The quota still remains and requires administrative removal if desired

Application logical quotas, available in OneFS 8.2 and later, provide a quota accounting metric, which accounts for, reports and enforces on the actual space consumed and available for storage, independent of whether files are on-premises or cloud-tiered.

In addition to data-protection overhead, the option is provided on whether to include snapshot data when calculating a quota’s usage limits.

SmartQuotas will only report on snapshots created after the quota domain was created. This is because determining quota governance (including QuotaScan job) for existing snapshots is a very time and resource consuming operation. However, as snapshots age out, SmartQuotas will gradually accrue accounting information for the entire set of relevant snapshots.

Compressed and deduplicated files appear no differently than regular files to standard quota policies. However, for deduplicated files, if the quota is configured to include data-protection overhead, the additional space used by the shadow store will not be accounted for by the quota.

OneFS and QLC SED Drives

A couple of days ago on 5th January, Dell announced support for quad-level cell (QLC) self-encrypting (SED) flash media for PowerScale. Specifically, the F900 and F600 all-flash NVMe platforms are now available with 15.4TB and 30.7TB QLC SED NVMe drives.

These new QLC SED drives offer a compelling blend of security, capacity, performance, reliability and affordability – and will be particularly beneficial for sensitive workloads and datasets requiring at-rest encryption.

The details of the new QLC SED drive options for the F600 and F900 platforms are as follows:

PowerScale Node Chassis specs

(per node)

Raw capacity

(per node)

Max Raw capacity
(252 node cluster)
F900 2U with 24 NVMe SSD drives 737.28TB with 30.72TB QLC

368.6TB with 15.36TB QLC

185.79PB with 30.72TB QLC

92.83PB with 15.36TB QLC

F600 1U with 8 NVMe SSD drives 245.76TB with 30.72TB QLC

122.88TB with 15.36TB QLC

61.93PB with 30.72TB QLC

30.96PB with 15.36TB QLC

This allows a PowerScale F900 cluster with the 30.7TB QLC SED drives to grow up to 185.79PB of raw encrypted data capacity in a single volume, coupled with predictable linear performance scaling!

The new QLC SED drives double the all-flash capacity footprint for encrypted data, as compared to previous generations – while delivering robust environmental efficiencies in consolidated rack space, power and cooling. What’s more, PowerScale F600 and F900 nodes containing QLC SED drives can deliver the same level of performance as TLC SED drives, thereby delivering vastly superior economics and value.

QLC-based F600 and F900 SED nodes can easily be rapidly and non-disruptively integrated into existing PowerScale clusters.

Before we get into the details, a quick terminology review:

Term Details
DARE Data-at-rest encryption
FIPS Federal Information Processing Standard 140 (currently at version 3: FIPS 140-3)
ISE Instant Secure Erase (Drives that support crypto erase but are not SEDs)
Non-FIPS SED drive that supports data-at-rest encryption, but has not yet been FIPS 140-3 certified.
QLC Quad-level cell, high capacity SSD (4 bits per cell).
SED Self-encrypting drive that supports data-at-rest encryption (includes both FIPS and non-FIPS drives).
SSD Solid State Drive, using flash memory for storage rather than spinning magnetic media.
TLC Tri-level cell SSD (3 bits per cell).

With the introduction of a new version of the FIPS 140 standard (FIPS 140-3), these new QLC SED drives fall under the ‘non-FIPS’ category above, and are currently intended for customers that need data-at-rest encryption but do not explicitly require US FIPS certification. That said, FIPS 140-3 certification of these QLC SED SSD drives is in porgess and will be completed later this year.

Under the hood, PowerScale support for these new drives requires the addition of a new ‘QLC SED-Non-FIPS’ OneFS drive category. Since the overall data-at-rest protection provided by a cluster is determined by the lowest protection offered by any component in the cluster, if a cluster contains any SED-Non-FIPS drives, it cannot claim to provide FIPS-certified protection. As such, actions that would reduce the protection level provided by a cluster are blocked.

OneFS 9.4.0.8 now recognizes the following drive types with their corresponding SED compliance level:

SED Drive Type Compliance Level
SED-NON-FIPS 0
SED-FIPS 1
SED-FIPS-140-2 2
SED-FIPS-140-3 3

For the curious, the compliance level can be queried via a SED node’s drives-psi.conf file. For example:

# cat /etc/psi.conf.d/drives-psi.conf | grep -i compliance

compliance_level = 0;

From the WebUI, the ‘drive details’ pop-up window in OneFS 9.4.0.8 is extended to display the drive’s compliance status via a new ‘SED Compliance Level’ field. This can be viewed by navigating to Hardware configuration > Drives and selecting ‘View details’ for the desired drive:

The ‘isi device drive view’ CLI command in OneFS 9.4.0.8 also reports the ‘SED Compliance Level’ field:

# isi device drive view 10

Lnn: 1

Location: Bay 10

Lnum: N/A

Device: /dev/nvd2

Baynum: 10

Handle: 364

Serial: PHAC2044006Y15PHGN

Model: Dell Ent NVMe SED P5316 RI 15.36TB

Tech: NVME

Media: SSD

Media Class: QLC

SED Compliance Level: SED-NON-FIPS 

Blocks: 30001856512

Logical Block Length: 512

Physical Block Length: 512 W

WN: 01000000010000005CD2E4B110325551

State: WRONG_TYPE

Purpose: UNKNOWN

Purpose Description: A drive whose purpose is unknown

Present: Yes

Percent Formatted: 0

Or from the ‘isi status –node’ CLI command, which is also enhanced to display a new node-level ‘SED Compliance Level’ attribute:

# isi status --node 1

Node LNN:               1

Node ID:                1

Node Name:              tme-1

Node IP Address:       10.9.24.76

Node Health:            -A—

Node Ext Conn:          C

Node SN:                8QMKR33

SED Compliance Level:   SED-NON-FIPS 

Member of Node Pools:   n/a

Member of Tiers:        n/a

Node Capacity:          19.0T

Available:              19.0T (> 99%)

Used:                   1.1G (< 1%)

Similarly, the node compliance level is reported in the OneFS 9.4.0.8 WebUI for each drive in Hardware Configuration->Nodes->Node Details. For example:

Additionally, PowerScale F600 and F900 nodes must be running OneFS 9.4.0.8 and DSP v1.43.2 or later in order to support QLC SED drives. In the event of a QLC SED drive failure, it must be replaced with another QLC  SED drive. More specifically:

Node Type Drive Type Drive Supported
ISE ISE Yes
ISE SED-Non-FIPS No
ISE SED-FIPS No
SED-Non-FIPS ISE No
SED-Non-FIPS SED-Non-FIPS Yes
SED-Non-FIPS SED-FIPS Yes
SED-FIPS ISE No
SED-FIPS SED-Non-FIPS No
SED-FIPS SED-FIPS Yes

If the wrong type of drive is inadvertently added to a node, the ‘SYS_DISK_WRONGTYPE’ CELOG event will provide a detailed description of why the drive is incorrect.

Also, per the OneFS compatibility rules, joins of SED-Non-FIPS nodes to SED-FIPS clusters are also blocked.

Minimum Node in Cluster Joining Node Type Join Supported
SED-Non-FIPS ISE No
SED-Non-FIPS SED-Non-FIPS Yes
SED-Non-FIPS SED-FIPS Yes
SED-FIPS ISE No
SED-FIPS SED-Non-FIPS No
SED-FIPS SED-FIPS Yes

Finally, any attempts to downgrade a QLC SED node to a version prior to OneFS 9.4.0.8 will be blocked.