The previous post about customizable CELOG alerts generated a number of questions from the field. So, over the course of the next couple of articles we’ll be reviewing the fundamentals of OneFS logging and alerting.
The OneFS Cluster Event Log (or CELOG) provides a single source for the logging of events that occur in an Isilon cluster. Events are used to communicate a picture of cluster health for various components. CELOG provides a single point from which notifications about the events are generated, including sending alert emails and SNMP traps.
Cluster events can be easily viewed from the WebUI by browsing to Cluster Management > Events and Alerts > Events. For example:
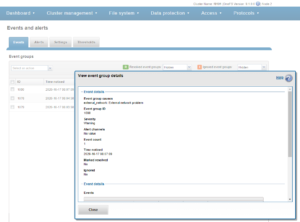
Or from the CLI, using the ‘isi event events view’ syntax:
![]()
# isi event events view 2.370158

           ID: 2.370158

Eventgroup ID: 271428

   Event Type: 600010001

      Message: The snapshot daemon failed to create snapshot 'Hourly - prod' in schedule 'Hourly @ Every Day': error: Name collision

        Devid: 2

          Lnn: 2

         Time: 2020-10-19T17:01:33

     Severity: warning

        Value: 0.0
In this instance, CELOG communicates on behalf of SnapshotIQ that it’s failed to create a scheduled hourly snapshot because of an issue with the naming convention.
At a high level, processes that monitor conditions on the cluster or log important events during the course of their operation communicate directly with the CELOG system. CELOG receives event messages from other processes via a well-defined API.
A CELOG event often contains the following elements:
| Element | Definition |
| Event | Events are generated by the system and may be communicated in various ways (email, snmp traps, etc), depending upon the configuration. |
| Specifier | Specifiers are strings containing extra information, which can be used to coalesce events and construct meaningful, readable messages. |
| Attachment | Extra chunks of information, such as parts of log files or sysctl output, added to email notifications to provide additional context about an event. |
For example, in SnapshotIQ event above, we can see the event text contains a specifier and attachment that has been mostly derived from the corresponding syslog message:
# grep "Hourly - prod" /var/log/messages* | grep "2020-10-19T17:01:33"

2020-10-19T17:01:33-04:00 <3.3> a200-2 isi_snapshot_d[5631]: create_schedule_snapshot: snapshot schedule (Hourly @ Every Day) pattern created a snapshot name collision (Hourly - prod); scheduled create failed.
CELOG is a large, complex system, which can be envisioned as a large pipeline. It gathers events and statistics info on one end from isi_stats_d and isi_celog_monitor, plus directly other applications such as SmartQuotas, SyncIQ, etc. These events are passed from one functional block to another, with a database at the end of the pipe. Along the way, attachments may be generated, notifications sent, and events passed to a coalescer.
On the front end, there are two dispatchers, which pass communication from the UNIX socket and network to their corresponding handlers. As events are processed, they pass through a series of coalescers. At any point they may be intercepted by the appropriate coalescer, which creates a coalescing event and which will accept other related events.
As events drop out the bottom of the coalescer stack, they’re deposited in add, modify and delete queues in the backend database infrastructure. The coalescer thread then moves onto pushing things into the local database, forwarding them along to the primary coalescer, and queueing events to have notifications sent and/or attachments generated.
The processes of safely storing events, analyzing them, deciding on what alerts to send and sending them is separated into four separate modules within the pipeline:
The following table provides a description of each of these CELOG modules:
| Module | Definition |
| Capture | The first stage in the processing pipeline, Event Capture is responsible for reading event occurrences from the kernel queue, storing them safely on persistent local storage, generating attachments, and queueing them by priority for analysis. |
| Analysis | Extra chunks of information (log file extracts, sysctl output, etc) are added to alert notifications to provide additional context about an event. |
| Reporter | The Reporter is the third stage in the processing pipeline, and runs on only one node in the cluster. It periodically queries Event Analysis for changes and generates alert requests for any relevant conditions. |
| Alerter | The Alerter is the final stage in the processing pipeline, responsible for actually delivering the alerts requested by the reporter. There is a single sender for each enabled channel on the cluster. |
CELOG local and backend database redundancy ensures reliable event storage and guards against bottlenecks.
By default, OneFS provides the following event group categories, each of which contain a variety of conditions, or ‘event group causes’, which will trigger an event if their conditions are met:
| Event Group Category | Event Series Number |
| System disk events | 1000***** |
| Node status events | 2000***** |
| Reboot events | 3000***** |
| Software events | 4000***** |
| Quota events | 5000***** |
| Snapshot events | 6000***** |
| Windows networking events | 7000***** |
| Filesystem events | 8000***** |
| Hardware events | 9000***** |
| CloudPools events | 11000***** |
Say, for example a chassis fan fails in one of a cluster’s nodes. OneFS will likely capture multiple hardware events. For instance:
- Event # 90006003 related to the physical power supply
- Event # 90020026 for an over-temperature alert
All the events relating to the fan failure will be represented in a single event group, which allows the incident to be communicated and managed as a single, coherent issue.
Detail on individual events can be viewed for each item. For example, the following event is for a drive firmware incompatibility.
Drilling down into the event details reveals the event number – in this case, event # 100010027:
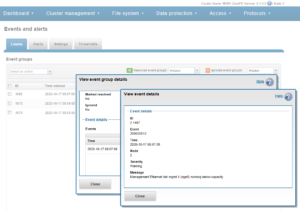
OneFS events and alerts info is available online at the CELOG event reference guide.
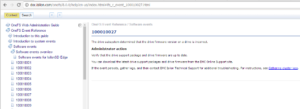
The Event Help information will often provide an “Administrator Action” plan, which, where appropriate, provides troubleshooting and/or resolution steps for the issue.
For example, here’s the Event Help for snapshot delete failure event # 600010002:
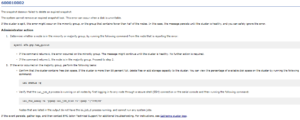
The OneFS WebUI Cluster Status dashboard shows the event group info at the bottom of the page.
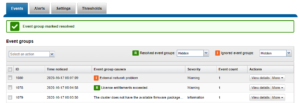
More detail and configuration can be found in the Events and Alerts section of the Cluster Management WebUI. This can be accessed via the “Manage event groups” link, or by browsing to Cluster Management > Events and Alerts > Events.