OneFS Multi-tenancy and Zone-aware Access Control

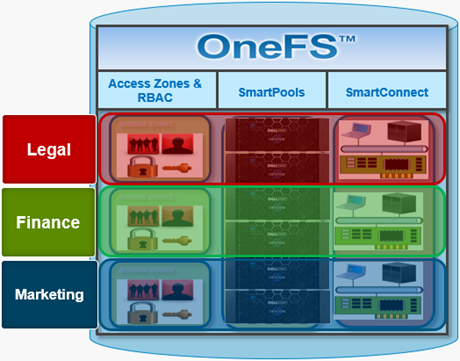
Multi-tenancy in OneFS is predicated upon the following four areas:

Area Feature Description
Security Access Zones Share and export-level access control departmental segregation
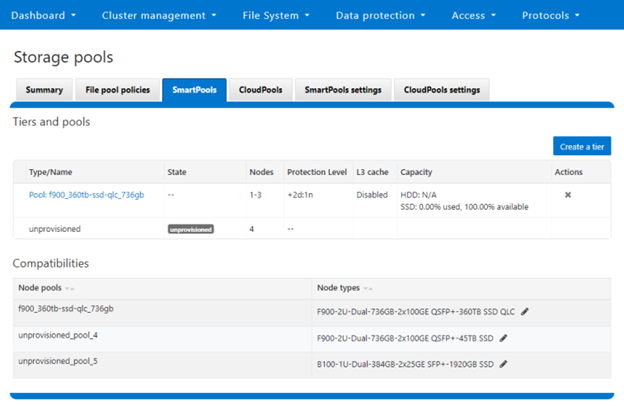
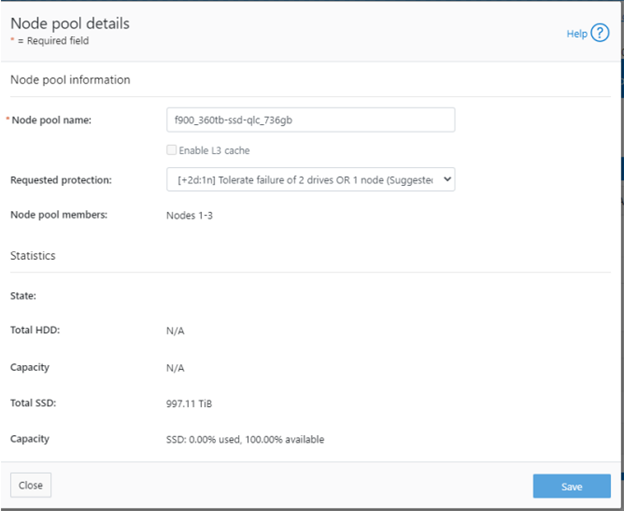
Data SmartPools Nodepools and Tiers for data segregation
Networking SmartConnect Groupnets and Zones for network segmentation
Administration RBAC Data access and administration separation

For authentication and access control, OneFS Access Zones provide a way to associate the cluster with multiple sets of auth providers to provide varied access to cluster resources. Each zone contains the necessary configuration to support authentication and identity management services for client access to OneFS.

A combination of SmartConnect zones, node pools, and access zones enables the separation of authentication providers into different groups and provides a mechanism to limit data access to specific node groups, network interfaces, directory hierarchies and file system areas. The following image shows three ‘tenants’ (in this case business units in an enterprise), each with their own subset of cluster resources – network pool, node pool, and authentication & identity management infrastructure.

Within OneFS, Role-based access control (RBAC) provides the ability to grant cluster administrators the necessary privileges to perform various tasks through the Platform API, such as creating/modifying/viewing NFS exports, SMB shares, authentication providers, and various cluster settings. For example, data center operations staff can be assigned read-only rights to the entire cluster, allowing full monitoring access but no configuration changes to be made. OneFS provides a collection of built-in roles, including audit, system & security administrator, plus the ability to create custom defined roles, either per access zone or across the cluster. Roles Based Administration is integrated with the OneFS command line interface, WebUI and Platform API.

OneFS RBAC enables roles and a subset of zone-aware privileges to be assigned on a per-access-zone basis. This allows administrative tasks covered by the zone-aware privileges to be permitted inside a specific access zone, by defining a ‘local administrator’ for that zone. A user in the System access zone still has the ability to administer all other access zones, and so remains a ‘global administrator’. However, a user in a non-System access zone can also be given a set or privileges to act as a ‘local administrator’ for that particular zone, as well as being able to view (but not modify) global settings related to those privileges.

The following privileges are available in non-System access zones:

Privilege Description
ISI_PRIV_LOGIN_PAPI Log in to Platform API and WebUI
ISI_PRIV_AUTH Configure identities, roles and authentication providers
ISI_PRIV_AUTH_GROUPS User groups from authentication provider
ISI_PRIV_AUTH_PROVIDERS Configure Auth providers
ISI_PRIV_AUTH_RULES User mapping rules.
ISI_PRIV_AUTH_SETTINGS_ACLS Configure ACL policy settings
ISI_PRIV_AUTH_SETTINGS_GLOBAL Configure global authentication settings
ISI_PRIV_AUTH_USERS Users from authentication providers
ISI_PRIV_AUTH_ZONES Configure access zones
ISI_PRIV_RESTRICTED_AUTH Configure identities with the same or lesser privilege
ISI_PRIV_RESTRICTED_AUTH_GROUPS Configure identities with the same or lesser privilege
ISI_PRIV_RESTRICTED_AUTH_USERS Configure identities with the same or lesser privilege
ISI_PRIV_ROLE Create new roles and assign privileges
ISI_PRIV_AUDIT Configure audit capabilities
ISI_PRIV_FILE_FILTER Configure File Filtering based on file types
ISI_PRIV_FILE_FILTER_SETTINGS File Filtering service and filter settings
ISI_PRIV_HDFS Setup HDFS Filesystem, service, users and settings
ISI_PRIV_HDFS_FSIMAGE_JOB_SETTINGS HDFS FSImage job settings
ISI_PRIV_HDFS_FSIMAGE_SETTINGS HDFS FSImage service settings
ISI_PRIV_HDFS_INOTIFY_SETTINGS HDFS Inotify service settings
ISI_PRIV_HDFS_PROXYUSERS Proxy users and members
ISI_PRIV_HDFS_RACKS HDFS virtual rack settings
ISI_PRIV_HDFS_RANGERPLUGIN_SETTINGS Settings for the HDFS ranger plugin
ISI_PRIV_HDFS_SETTINGS HDFS Service, protocol and ambari server settings
ISI_PRIV_NFS Setup NFS Service, exports and configure settings
ISI_PRIV_NFS_ALIASES Aliases for export directory names
ISI_PRIV_NFS_EXPORTS NFS Exports and permissions
ISI_PRIV_NFS_SETTINGS NFS export and other settings
ISI_PRIV_NFS_SETTINGS_EXPORT NFS export and user mapping settings
ISI_PRIV_NFS_SETTINGS_GLOBAL NFS global and service settings
ISI_PRIV_NFS_SETTINGS_ZONE NFS zone related settings
ISI_PRIV_PAPI_CONFIG Configure the Platform API and WebUI
ISI_PRIV_S3 Setup S3 Buckets and configure settings
ISI_PRIV_S3_BUCKETS S3 buckets and ACL
ISI_PRIV_S3_MYKEYS S3 key management
ISI_PRIV_S3_SETTINGS S3 global and zone settings
ISI_PRIV_S3_SETTINGS_GLOBAL S3 global and service settings
ISI_PRIV_S3_SETTINGS_ZONE S3 zone related settings
ISI_PRIV_SMB Setup SMB Service, shares and configure settings
ISI_PRIV_SMB_SESSIONS Active SMB sessions
ISI_PRIV_SMB_SETTINGS View and manage SMB settings
ISI_PRIV_SMB_SETTINGS_GLOBAL SMB global and service settings
ISI_PRIV_SMB_SETTINGS_SHARE SMB filter and share Settings
ISI_PRIV_SMB_SHARES SMB shares and permissions
ISI_PRIV_SWIFT Configure Swift
ISI_PRIV_VCENTER Configure VMware vCenter
ISI_PRIV_IFS_BACKUP Backup files from /ifs
ISI_PRIV_IFS_RESTORE Restore files to /ifs
ISI_PRIV_NS_TRAVERSE Traverse and view directory metadata
ISI_PRIV_NS_IFS_ACCESS Access /ifs via RESTful Access to Namespace service

Additionally, two built-in roles are provided by default in a non-System access zone:

Role Description Privilege
ZoneAdmin Allows administration of aspects of configuration related to current access zone ·         ISI_PRIV_LOGIN_PAPI

·         ISI_PRIV_AUDIT

·         ISI_PRIV_FILE_FILTER

·         ISI_PRIV_HDFS

·         ISI_PRIV_NFS

·         ISI_PRIV_SMB

·         ISI_PRIV_SWIFT

·         ISI_PRIV_VCENTER

·         ISI_PRIV_NS_TRAVERSE

·         ISI_PRIV_NS_IFS_ACCESS

ZoneSecurityAdmin Allows administration of aspects of security configuration related to current access zone ·         ISI_PRIV_LOGIN_PAPI

·         ISI_PRIV_AUTH

·         ISI_PRIV_ROLE

Note that neither of these roles has any default users automatically assigned.

With RBAC, an authentication provider created from the System access zone can be viewed and used by all other access zones. However, it can only be modified/deleted from System access zone.

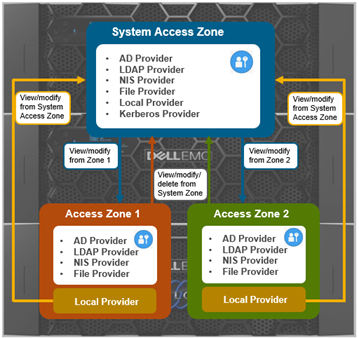
Be aware that a Kerberos provider can only be created from the System access zone.

With RBAC, an authentication provider created from a non-System access zone can only be used by that specific access zone. However, it can be administered (ie. viewed/modified/deleted) from either its access zone or the System access zone.

A local provider from a non-System access zone can only be used by that specific non-System access zone. It cannot be used by other access zones, including System access zone, and can only be viewed/modified from that specific non-system access zone and plus the system access zone.

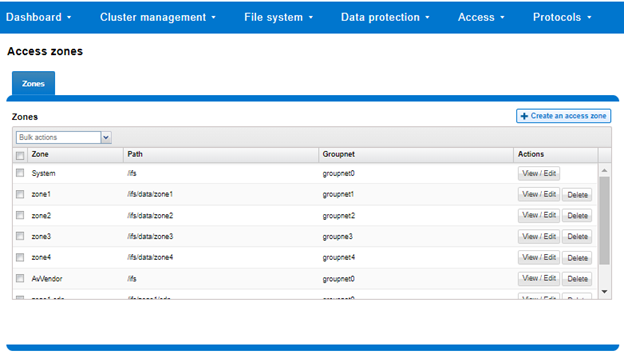
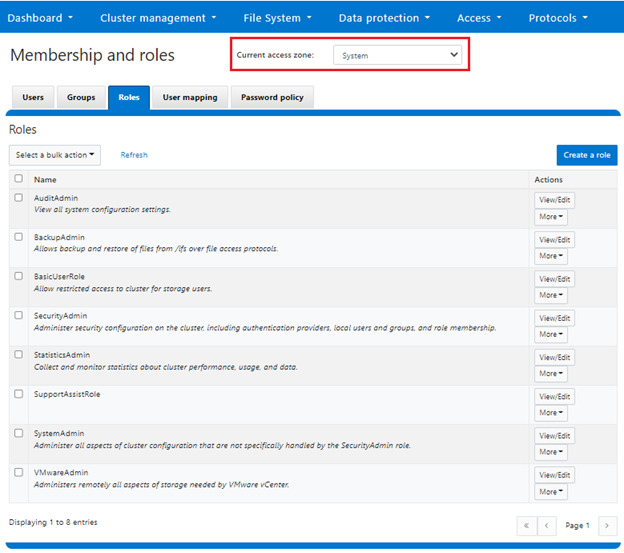
To support zone-aware RBAC, the OneFS WebUI includes a ‘current access zone’ field to select the desired zone. This is located under Access > Membership and Roles:

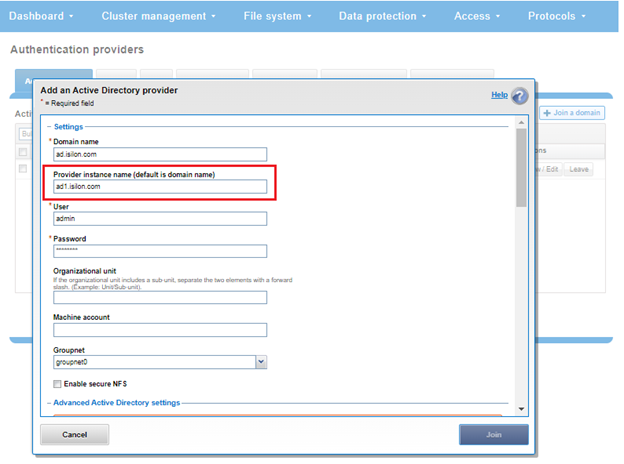
An ‘instance’ configuration field is used to identify specific AD authentication providers. There could be multiple AD authentication providers referring to a same domain and must specify an instance name and a machine account name

Each access zone’s administrator(s) can create their own AD authentication provider to connect to the same domain. This can be configured from either the WebUI or CLI command. However, each access zone can still only include a single AD authentication provider.

In the WebUI, the ‘instance name’ field appears under the ‘Add an Active Directory provider’ configuration screen, accessed by navigating to Access > Authentication Providers > Active Directory > Join a Domain:

Similarly, the ‘isi auth ads create’ CLI command sees the addition of ‘–instance’ and ‘–machine-account’ arguments. For example:

# isi auth ads create --name=ad.isilon.com --user=Administrator –-instance=ad1 –-machine-account=my-isilon123

The ‘instance’ name can then be used to reference the AD provider

# isi auth ads view ad1

To illustrate, take the following roles and privileges example. The smb2 role is created in zone2 and a user, smbuser2, added to the smb2 role:

# isi auth roles create --zone=zone2 smb2

# isi auth users create --zone=zone2 smbuser2

# isi auth roles modify smb2 --zone=zone2 --add-priv=ISI_PRIV_LOGIN_PAPI --add-priv=ISI_PRIV_SMB –-add-user=smbuser2

# isi auth roles modify smb2 --zone=zone2 --add-priv=ISI_PRIV_NETWORK

Privilege ISI_PRIV_NETWORK cannot be added to role in non-System access zone

# isi smb share create --zone=zone2 share2 /ifs/data/zone2

# isi_run -z zone2 -l smbuser2 isi smb shares list

Share Name   Path

---------------------------

Share2 /ifs/data/zone2

---------------------------

Total: 1

# isi_run -z zone2 -l smbuser2 isi nfs exports list

Privilege check failed. The following read privilege is required: NFS (ISI_PRIV_NFS)

As shown above, the smbuser2 can log into the WebUI via zone2 and can create/modify/view SMB shares/settings in zone2. Smbuser2 can also view, but not modify, global SMB configuration settings. However, Smbuser2 is not be able to view/modify shares in other zones.

When connecting to a cluster via the SSH session protocol to perform CLI configuration, be aware that SSH access is still only available from System access zone. As such, administrators coming from non-System access zones will only be able to use the WebUI or platform API to perform cluster configuration and management.

The ‘isi auth role’ CLI command offers a ‘–zone’ argument to report on specific access zones.:

# isi auth roles list -–zone=zone2

With no ‘–zone’ option specified, this command returns a list of roles in the current access zone.

Note that multiple instances connected to the same AD provider can be configured so long as each has a unique machine account name.

To help with troubleshooting permissions issues, the ‘isi_run’ CLI utility can be used to run OneFS CLI command(s) as if it were coming from a non-System zone. For example:

# isi_run -z zone2 isi auth roles list

Note that a zone name can be used as well as the zone ID as an argument for the -z (zone) flag option, as above.

In Kerberos environments, in order to work with AD, the appropriate service principal name (SPN) must be created in the appropriate Active Directory machine accounts, and duplicate SPNs must be avoided.

OneFS provides the ‘isi auth ads spn’ CLI command set to verify and manage SPN configuration. Command options include:

  • Show which SPNs are missing or extra as compared to expected SPNs:
# isi auth ads spn check <AD-instance-name>
  • Add and remove missing/extra SPNs:
# isi auth ads spn fix <AD-instance-name>  --user=<Administrator>
  • Add, but avoid removing extra SPNs:
# isi auth ads  spn fix <AD-instance-name> --noremove
  • Add an SPN, and add to ‘expected SPN’ list:
# isi auth ads spn create <AD-instance-name> <SPN>
  • Delete an SPN and remove from ‘expected SPN’ list:
# isi auth ads spn delete <AD-instance-name> <SPN>

OneFS Environmentals Reporting

The Energy Star for storage initiative is a SNIA-defined criteria, in conjunction with the EPA and DoE, to evaluate the energy efficiency of a storage system. While earlier OneFS versions adhered to Energy Star 1.1 from 2014, OneFS 9.2 and later support the latest Energy Star 2.0 version. This allows a compliance engineer or administrator to easily query inlet temperature and power consumption via a simple, convenient interface. It also enables third-party datacenter management software to access environmental data via a standard network connection and take appropriate actions if an anomaly is reported. Energy star information is available via the CLI on clusters running in both enterprise and compliance mode

Under the hood, the power and temperature data is retrieved through the IPMI interface. Command support is at the node level, and values are cached for up to five seconds after retrieval.

The CLI syntax involves the ‘isi_estar’ command, which can be used to obtain energy star data from the following supported PowerScale platforms:

  • F-series: F200, F600, F900, F800, F810
  • H-series: H400, H500, H5600, H600, H700, H7000
  • A-series: A200, A2000, A300, A3000
  • Accelerators: P100, B100

For example, the output from an F600 node reports:

# isi_for_array -s isi_estar

f600prime-1: Input power:             374.000

f600prime-1: Inlet air temperature:   19.000

Note that all previous generation platforms are unsupported and will return the following error:

 “ERROR – Error reading psi sensor name, platform not supported.”

However, for nodes that don’t support the ‘isi_estar’ CLI command, similar output can be obtained using the ‘isi_hw_status -wt’ CLI command syntax. For example:

# isi_hw_status -wt | grep -e Ambient_Temp -e Pwr_Consumption

Pwr_Consumption                 = 424.000

Ambient_Temp                    = 26.000

Since the ‘isi_estar’ command is node-local, in order to report on all the nodes in the cluster it can be run via the isi_for_array utility. upplies.

# isi_for_array -s isi_estar

f600prime-1: Input power:             374.000

f600prime-1: Inlet air temperature:   19.000

f600prime-2: Input power:             374.000

f600prime-2: Inlet air temperature:   20.000

f600prime-3: Input power:             374.000

f600prime-3: Inlet air temperature:   21.000

The ‘input power’ metric displays the combined power consumption in watts for both of a node’s power supplies.

To continuously sample isi_estar output at 30 second intervals, use the following syntax:

# while true; do date; isi_estar; sleep 30; done

Another useful utility for easily verifying the status of the nodes’ journal batteries in a cluster is the ‘isi batterystatus’ CLI command set. For example:

# isi batterystatus list

Lnn  Status1                           Status2  Result1  Result2

-----------------------------------------------------------------

1    Ready, enabled, and fully charged N/A      passed   N/A

2    Ready, enabled, and fully charged N/A      passed   N/A

3    Ready, enabled, and fully charged N/A      passed   N/A

4    Ready, enabled, and fully charged N/A      passed   N/A

Detailed status for a particular nodes is also available:

# isi batterystatus view

            Lnn: 1

        Status1: Ready and enabled

        Status2: N/A

        Result1: passed

        Result2: N/A

Last Test Time1: Mon Sep 12 23:59:50 2022

Next Test Time1: Fri Sep 23 09:59:50 2022

Last Test Time2: N/A

Next Test Time2: N/A

      Supported: Yes

        Present: Yes

For more detailed hardware and environmental data, the ‘isi_hw_status’ CLI command can also be useful with its plethora of information:

# isi_hw_status

  SerNo: JACNT194340156

 Config: 110-385-400B-04

ChsSerN: JACNN194420707

ChsSlot: 4

FamCode: H

ChsCode: 4U

GenCode: 0

PrfCode: 5

   Tier: 3

  Class: storage

 Series: n/a

Product: H500-4U-Single-128GB-1x1GE-2x10GE SFP+-30TB-1638GB SSD

  HWGen: PSI

Chassis: INFINITY (Infinity Chassis)

    CPU: GenuineIntel (2.20GHz, stepping 0x000406f1)

   PROC: Single-proc, 10-HT-core

    RAM: 137226121216 Bytes

   Mobo: INFINITY (Custom EMC Motherboard)

  NVRam: INFINITY (Infinity Memory Journal) (4096MB card) (size 4294967296B)

 DskCtl: PMC8074 (PMC 8074) (8 ports)

 DskExp: PMC8056I (PMC-Sierra PM8056 - Infinity)

PwrSupl: Slot3-PS0 (type=ARTESYN, fw=02.14)

PwrSupl: Slot4-PS1 (type=ARTESYN, fw=02.14)

  NetIF: bge0,mlxen0,mlxen1,mlxen2,mlxen3

 IBType: Unknown (None)

 BEType: 40GigE

 FEType: 10GigE

 LCDver: IsiVFD2 (Isilon VFD V2)

 Midpln: NONE (No Midplane Support)

Power Supplies OK

Power Supply Slot3-PS0 good

Power Supply Slot4-PS1 good

CPU Operation (raw 0x88290000)  = Normal

CPU Speed Limit                 = 100.00%

Fan0_Speed                      = 6600.000

Fan1_Speed                      = 6600.000

Slot3-PS0_In_Voltage            = 209.000

Slot4-PS1_In_Voltage            = 209.000

SP_CMD_Vin                      = 12.200

CMOS_Voltage                    = 3.080

Slot3-PS0_Input_Power           = 176.000

Slot4-PS1_Input_Power           = 216.000

Pwr_Consumption                 = 400.000

DIMM_Bank0                      = 46.000

DIMM_Bank1                      = 47.000

CPU0_Temp                       = -36.000

SP_Temp0                        = 40.000

MP_Temp0                        = 27.000

Hottest_HDD_Temp                = 20.000

Ambient_Temp                    = 27.000

Slot3-PS0_Temp0                 = 64.000

Slot3-PS0_Temp1                 = 37.000

Slot4-PS1_Temp0                 = 66.000

Slot4-PS1_Temp1                 = 40.000

Battery0_Temp                   = 41.000

Altitude                        = 120.000

Note that, unlike the ‘isi_estar’ command, ‘isi_hw_status’ will run on all PowerScale and earlier generation Isilon nodes.

Options for the ‘isi_hw_status’ CLI command include:

Flag Description
-S pct set CPU speed throttling to given percentage
-C clear CPU overtemp indicator
-L use list-format
-T use table-format
-H suppress headers in table-format mode
-HH shows _only_ the headers in table-format mode
-c show system components
-d show debug-level system components (-dd for more)
-F show system component flags
-i show system identification
-s show system state
-f show fan speeds
-v show voltages
-a show currents
-w show watts
-t Show temperatures
-m Show meters
-I Show miscellaneous inputs
-b Show NVRAM status
-V Turns on verbose output
-g Turns on debug output
-q Turns on quiet mode (suppesses extra verbose/debug output)
-A Show all output
-r Disable IPMI command cache reads on IPMI-based platforms
-P Probe and update hardware state info in PSI

For example, the ‘isi_hw_status’ command run with the ‘-sfvt’ flags can be useful to show a node’s environmental data:

# isi_hw_status -sfvt

Power Supplies OK

Power Supply Slot3-PS0 good

Power Supply Slot4-PS1 good

CPU Operation (raw 0x88290000)  = Normal

CPU Speed Limit                 = 100.00%

Fan0_Speed                      = 6600.000

Fan1_Speed                      = 6600.000

Slot3-PS0_In_Voltage            = 212.000

Slot4-PS1_In_Voltage            = 213.000

SP_CMD_Vin                      = 12.200

CMOS_Voltage                    = 3.080

DIMM_Bank0                      = 43.000

DIMM_Bank1                      = 44.000

CPU0_Temp                       = -36.000

SP_Temp0                        = 38.000

MP_Temp0                        = 26.000

Hottest_HDD_Temp                = 20.000

Ambient_Temp                    = 26.000

Slot3-PS0_Temp0                 = 58.000

Slot3-PS0_Temp1                 = 33.000

Slot4-PS1_Temp0                 = 62.000

Slot4-PS1_Temp1                 = 37.000

Battery0_Temp                   = 38.000

Note that the ‘isi_hw_status’ command output can also be viewed in table format with the ’-T’ flag, in order to aid readability.

Additionally, the OneFS stats engine records virtually all of the sensor data, a list of which can be obtained by running:

# isi statistics list keys list | grep sensor.temp

For example, the temperature sensors on an H700 include:

node.sensor.temp.celsius.Ambient_Temp

node.sensor.temp.celsius.Battery0_Temp

node.sensor.temp.celsius.CPU0_Temp

node.sensor.temp.celsius.DIMM_Bank0

node.sensor.temp.celsius.DIMM_Bank1

node.sensor.temp.celsius.Drive_IO0_Temp

node.sensor.temp.celsius.Embed_IO_Temp0

node.sensor.temp.celsius.Hottest_SAS_Drv

node.sensor.temp.celsius.MP_Temp0

node.sensor.temp.celsius.MP_Temp1

node.sensor.temp.celsius.SLIC0_Temp

node.sensor.temp.celsius.SLIC1_Temp

node.sensor.temp.celsius.SP_Temp0

node.sensor.temp.celsius.Slot1-PS0_Temp0

node.sensor.temp.celsius.Slot1-PS0_Temp1

node.sensor.temp.celsius.Slot2-PS1_Temp0

node.sensor.temp.celsius.Slot2-PS1_Temp1

OneFS keeps in-memory a recent history of all of the stats that the engine collects.

For a node’s HDD and SSD drives, the ‘isi devices drive’ CLI command syntax can be used view status:

# isi devices drive list

Lnn  Location  Device    Lnum  State   Serial       Sled

---------------------------------------------------------

8    Bay  1    /dev/da1  15    L3      9VNX0JA00844 N/A

8    Bay  2    -         N/A   EMPTY                N/A

8    Bay  A0   /dev/da9  7     HEALTHY ZC23CH5P     A

8    Bay  A1   /dev/da2  14    HEALTHY ZC23CGX9     A

8    Bay  A2   /dev/da10 6     HEALTHY ZC23CGRE     A

8    Bay  B0   /dev/da3  13    HEALTHY ZC23C7WL     B

8    Bay  B1   /dev/da11 5     HEALTHY ZC23CH5Q     B

8    Bay  B2   /dev/da4  12    HEALTHY ZC23C8LQ     B

8    Bay  C0   /dev/da12 4     HEALTHY ZC23C8P0     C

8    Bay  C1   /dev/da5  11    HEALTHY ZC23C8C3     C

8    Bay  C2   /dev/da13 3     HEALTHY ZC23C8L1     C

8    Bay  D0   /dev/da6  10    HEALTHY ZC23C8FD     D

8    Bay  D1   /dev/da14 2     HEALTHY ZC23C7Z3     D

8    Bay  D2   /dev/da7  9     HEALTHY ZC23C874     D

8    Bay  E0   /dev/da15 1     HEALTHY ZC23C84D     E

8    Bay  E1   /dev/da8  8     HEALTHY ZC23C8LG     E

8    Bay  E2   /dev/da16 0     HEALTHY ZC23BC3X     E

---------------------------------------------------------

In this case, since it’s a chassis-based node, the drive location includes both bay and sled.

For more extensive drive information, the ‘isi_radish’ CLI command is also useful for querying a variety of drive heath and performance metrics, including drive and airflow temperatures. The ‘-T’ flag can be used to specifically report drive threshold violations:

# isi_radish -T

As mentioned previously, OneFS 9.0 and later releases also support the Intelligent Platform Management Interface protocol (IPMI), and, amongst other things, use this to gather the ‘isi_estar’ environmental data.

IPMI allows out-of-band console access and remote power control across a dedicated ethernet interface via Serial over LAN (SoL). As such, IMPI provides true lights-out management for PowerScale and Isilon Gen6 nodes without the need for additional rs-232 serial port concentrators or PDU rack power controllers.

For example, IPMI enables individual nodes, or the entire cluster, to be powered on after maintenance, or gracefully powered down after a power outage if the cluster is operating on limited backup power.

Similarly, IPMI facilitates performing a Hard/Cold Reboot/Power Cycle, for example, if a node is unresponsive to OneFS.

IPMI is enabled, configured, and operated from the CLI via the ‘isi ipmi’ command set and a cluster’s console can easily be accessed using the IPMItool utility. IPMItool is available as part of most Linux distributions, or accessible through other proprietary tools.

For the PowerScale F900, F600, F200, stand-alone nodes, the Dell iDRAC remote console option can also be accessed via an https web browser session to the default port 443 at a node’s IPMI address.

Note that in order to run the OneFS IPMI commands, the administrative account being used must have the ‘RBAC ISI_PRIV_IPMI’ privilege.

The following CLI syntax can be used to enable IPMI for DHCP:

# isi ipmi settings modify --enabled=True --allocation-type=dhcp 35 426 IPMI

Similarly, to enable IPMI for a static IP address:

# isi ipmi settings modify --enabled=True --allocation-type=static

To enable IPMI for a range of IP addresses use:

# isi ipmi network modify --gateway=[gateway IP] --prefixlen= --ranges=[IP Range]

The power control and Serial over LAN features can be configured and viewed using the following CLI command syntax. For example:

# isi ipmi features list

ID            Feature Description           Enabled

----------------------------------------------------

Power-Control Remote power control commands Yes

SOL           Serial over Lan functionality Yes

----------------------------------------------------

To enable the power control feature:

# isi ipmi features modify Power-Control --enabled=True

To enable the Serial over LAN (SoL) feature:

# isi ipmi features modify SOL --enabled=True

The following CLI commands can be used to configure a single username and password to perform IPMI tasks across all nodes in a cluster. Note that usernames can be up to 16 characters in length, while the associated passwords must be 17-20 characters in length.

To configure the username and password, run the CLI command:

# isi ipmi user modify --username [Username] --set-password

To confirm the username configuration, use:

# isi ipmi user view

Username: admin

On the client side, the ‘ipmitool’ command utility is ubiquitous in the Linux and UNIX world, and is included natively as part of most distributions. If not, it can easily be installed using the appropriate package manager, such as ‘yum’.

The ipmitool usage syntax is as follows:

[Linux Host:~]$ ipmitool -I lanplus -H [Node IP] -U [Username] -L OPERATOR -P [password]

For example, to execute power control commands:

ipmitool -I lanplus -H [Node IP] -U [Username] -L OPERATOR -P [password] power [command]

The ‘power’ command options above include status, on, off, cycle, and reset.

OneFS Diagnostics

In addition to the /usr/bin/isi_gather_info tool, OneFS also provides both a GUI and common ‘isi’ CLI version of the tool – albeit with slightly reduced functionality. This means that a OneFS log gather can be initiated either from the WebUI, or via the ‘isi diagnostics’ CLI command set with the following syntax:

# isi diagnostics gather start

The diagnostics gather status can also be queried as follows:

# isi diagnostics gather status

Gather is running.

Once the command has completed, the gather tarfile can be found under /ifs/data/Isilon_Support.

The ‘isi diagnostics’ configuration can also be viewed and modified as follows:

# isi diagnostics gather settings view

                Upload: Yes

                  ESRS: Yes

         Supportassist: Yes

           Gather Mode: full

  HTTP Insecure Upload: No

      HTTP Upload Host:

      HTTP Upload Path:

     HTTP Upload Proxy:

HTTP Upload Proxy Port: -

            Ftp Upload: Yes

       Ftp Upload Host: ftp.isilon.com

       Ftp Upload Path: /incoming

      Ftp Upload Proxy:

 Ftp Upload Proxy Port: -

       Ftp Upload User: anonymous

   Ftp Upload Ssl Cert:

   Ftp Upload Insecure: No

Configuration options for the ‘isi diagnostics gather’ CLI command include:

Option Description
–upload <boolean> Enable gather upload.
–esrs <boolean> Use ESRS for gather upload.
–gather-mode (incremental | full) Type of gather: incremental, or full.
–http-insecure-upload <boolean> Enable insecure HTTP upload on completed gather.
–http-upload-host <string> HTTP Host to use for HTTP upload.
–http-upload-path <string> Path on HTTP server to use for HTTP upload.
–http-upload-proxy <string> Proxy server to use for HTTP upload.
–http-upload-proxy-port <integer> Proxy server port to use for HTTP upload.
–clear-http-upload-proxy-port Clear proxy server port to use for HTTP upload.
–ftp-upload <boolean> Enable FTP upload on completed gather.
–ftp-upload-host <string> FTP host to use for FTP upload.
–ftp-upload-path <string> Path on FTP server to use for FTP upload.
–ftp-upload-proxy <string> Proxy server to use for FTP upload.
–ftp-upload-proxy-port <integer> Proxy server port to use for FTP upload.
–clear-ftp-upload-proxy-port Clear proxy server port to use for FTP upload.
–ftp-upload-user <string> FTP user to use for FTP upload.
–ftp-upload-ssl-cert <string> Specifies the SSL certificate to use in FTPS connection.
–ftp-upload-insecure <boolean> Whether to attempt a plain text FTP upload.
–ftp-upload-pass <string> FTP user to use for FTP upload password.
–set-ftp-upload-pass Specify the FTP upload password interactively.

As mentioned above, ‘isi diagnostics gather’  does not present quite as broad an array of features as the isi_gather_info utility. This is primarily for security purposes, since ‘isi diagnostics’ does not require root privileges to run. Instead, a user account with the ‘ISI_PRIV_SYS_SUPPORT’ RBAC privilege is needed in order to run a gather from either the WebUI or ‘isi diagnostics gather’ CLI interface.

Once a gather is running, a second instance cannot be started from any other node until that instance finishes. Typically, a warning along the lines of the following will be displayed:

"It appears that another instance of gather is running on the cluster somewhere. If you would like to force gather to run anyways, use the --force-multiple-igi flag. If you believe this message is in error, you may delete the lock file here: /ifs/.ifsvar/run/gather.node."

This lock can be removed as follows:

# rm -f /ifs/.ifsvar/run/gather.node

A log gather can also be initiated from the OneFS WebUI by navigating to Cluster management > Diagnostics > Gather:

The WebUI also uses the ‘isi diagnostics’ platform API handler and so, like the CLI command, also offers a subset of the full isi_gather_info functionality.

A limited menu of configuration options are also available via the WebUI under Cluster management > Diagnostics > Gather settings:

Also contained within the OneFS diagnostics command set is the ‘isi diagnostics netlogger’ utility. Netlogger captures IP traffic over a period of time for network and protocol analysis.

Under the hood, netlogger is a python wrapper around the ubiquitous tcpdump utility, and can be run either from the OneFS command line or WebUI.

For example, from the WebUI, browse to Cluster management > Diagnostics > Netlogger:

Alternatively, from the OneFS CLI, the isi_netlogger command captures traffic on interface (‘–interfaces’) over a timeout period of minutes (‘–duration’), and stores a specified number of log files ( ‘–count’).

Here’s the basic syntax of the CLI utility:

 # isi diagnostics netlogger start

        [--interfaces <str>]

        [--count <integer>]

        [--duration <duration>]

        [--snaplength <integer>]

        [--nodelist <str>]

        [--clients <str>]

        [--ports <str>]

        [--protocols (ip | ip6 | arp | tcp | udp)]

        [{--help | -h}]

Note that using the ‘-b’ bpf buffer size option will temporarily change the default buffer size while netlogger is running.

The command options include:

Netlogger Option Description
–interfaces <str> Limit packet collection to specified network interfaces.
–count <integer> The number of packet capture files to keep after they reach the duration limit. Defaults to the latest 3 files. 0 is infinite.
–duration <duration> How long to run the capture before rotating the capture file.  Default is 10 minutes.
–snaplength <integer> The maximum amount of data for each packet that is captured.  Default is 320 bytes. Valid range is 64 to 9100 bytes.
–nodelist <str> List of nodes specified by LNN on which to run the capture.
–clients <str> Limit packet collection to specified Client hostname / IP addresses.
–ports <str> Limit packet collection to specified TCP or UDP ports.
–protocols (ip | ip6 | arp | tcp | udp) Limit packet collection to specified protocols.

Netlogger’s log files are stored by default under /ifs/netlog/<node_name>.

The WebUI can also be used to configure the netlogger parameters under Cluster management > Diagnostics > Netlogger settings:

Be aware that ‘isi diagnostics netlogger’ can consume significant cluster resources. When running the tool on a production cluster, be cognizant of the effect on the system.

When the command has completed, the capture file(s) are stored under:

# /ifs/netlog/[nodename]

The following command can also be used to incorporate netlogger output files into a gather_info bundle:

# isi_gather_info -n [node#] -f /ifs/netlog

To capture on multiple nodes of the cluster, the netlogger command can be prefixed by the versatile isi_for_array utility:

# isi diagnostics netlogger --nodelist 2,3 --timeout 5 --snaplength 256

The command syntax above will create five minute incremental files on nodes 2 and 3, using a snaplength of 256 bytes, which will capture the first 256 bytes of each packet. These five-minute logs will be kept for about three days and the naming convention is of the form netlog-<node_name>-<date>-<time>.pcap. For example:

# ls /ifs/netlog/tme_h700-1

netlog-tme_h700-1.2022-09-02_10.31.28.pcap

When using netlogger, the ‘–snaplength’ option needs to be set appropriately based on the protocol being to capture the right amount of detail in the packet headers and/or payload. Or, if you want the entire contents of every packet, a value of zero (‘–snaplength 0’) can be used.

The default snaplength for netlogger is to capture 320 bytes per packet, which is typically sufficient for most protocols.

However, for SMB, a snaplength of 512 is sometimes required. Note that, depending on a node’s traffic quantity, a snaplength of 0 (eg: capture whole packet) can potentially overwhelm the network interface driver.

All the output gets written to files under /ifs/netlog directory, and the default capture time is ten minutes (‘–duration 10’).

Filters can be applied to the  filter to the end to constrain traffic to/from certain hosts or protocols. For example, to limit output to traffic between client 10.10.10.1:

# isi diagnostics netlogger --duration 5 --snaplength 256 --clients 10.10.10.1

Or to capture only NFS traffic, filter on port 2049:

# isi diagnostics netlogger --ports 2049

OneFS Logfile Collection with isi-gather-info

The previous blog article outlining the investigation and troubleshooting of OneFS deadlocks and hang-dumps generated several questions about OneFS logfile gathering. So it seemed like a germane topic to explore in an article.

The OneFS ‘isi_gather_info’  utility has long been a cluster staple for collecting and collating context and configuration that primarily aids support in the identification and resolution of bugs and issues. As such, it is arguably OneFS’ primary support tool and, in terms of actual functionality, it performs the following roles:

  1. Executes many commands, scripts, and utilities on cluster, and saves their results
  2. Gathers all these files into a single ‘gzipped’ package.
  3. Transmits the gather package back to Dell via several optional transport methods.

By default, a log gather tarfile is written to the /ifs/data/Isilon_Support/pkg/ directory. It can also be uploaded to Dell via the following means:

Transport Mechanism Description TCP Port
ESRS Uses Dell EMC Secure Remote Support (ESRS) for gather upload. 443/8443
FTP Use FTP to upload completed gather. 21
HTTP Use HTTP to upload gather. 80/443

More specifically, the ‘isi_gather_info’ CLI command syntax includes the following options:

Option Description
–upload <boolean> Enable gather upload.
–esrs <boolean> Use ESRS for gather upload.
–gather-mode (incremental | full) Type of gather: incremental, or full.
–http-insecure-upload <boolean> Enable insecure HTTP upload on completed gather.
–http-upload-host <string> HTTP Host to use for HTTP upload.
–http-upload-path <string> Path on HTTP server to use for HTTP upload.
–http-upload-proxy <string> Proxy server to use for HTTP upload.
–http-upload-proxy-port <integer> Proxy server port to use for HTTP upload.
–clear-http-upload-proxy-port Clear proxy server port to use for HTTP upload.
–ftp-upload <boolean> Enable FTP upload on completed gather.
–ftp-upload-host <string> FTP host to use for FTP upload.
–ftp-upload-path <string> Path on FTP server to use for FTP upload.
–ftp-upload-proxy <string> Proxy server to use for FTP upload.
–ftp-upload-proxy-port <integer> Proxy server port to use for FTP upload.
–clear-ftp-upload-proxy-port Clear proxy server port to use for FTP upload.
–ftp-upload-user <string> FTP user to use for FTP upload.
–ftp-upload-ssl-cert <string> Specifies the SSL certificate to use in FTPS connection.
–ftp-upload-insecure <boolean> Whether to attempt a plain text FTP upload.
–ftp-upload-pass <string> FTP user to use for FTP upload password.
–set-ftp-upload-pass Specify the FTP upload password interactively.

Once the gather arrives at Dell, it is automatically unpacked by a support process and analyzed using the ‘logviewer’ tool.

Under the hood, there are two principal components responsible for running a gather. These are:

Component Description
Overlord ·         The manager process, triggered by the user, which oversees all the isi_gather_info tasks which are executed on a single node.
Minion ·         The worker process, which runs a series of commands (specified by the overlord) on a specific node.

The ‘isi_gather_info’ utility is primarily written in python, with its configuration under the purview of MCP, and RPC services provided by the isi_rpc_d daemon.

For example:

# isi_gather_info&

# ps -auxw | grep -i gather

root   91620    4.4  0.1 125024  79028  1  I+   16:23        0:02.12 python /usr/bin/isi_gather_info (python3.8)

root   91629    3.2  0.0  91020  39728  -  S    16:23        0:01.89 isi_rpc_d: isi.gather.minion.minion.GatherManager (isi_rpc_d)

root   93231    0.0  0.0  11148   2692  0  D+   16:23        0:00.01 grep -i gather

The overlord uses isi_rdo (the OneFS remote command execution daemon) to start up the minion processes and informs them of the commands to be executed via an ephemeral XML file, typically stored at /ifs/.ifsvar/run/<uuid>-gather_commands.xml. The minion then spins up an executor and a command for each entry in the XML file.

The parallel process executor (the default one to use) acts as a pool, triggering commands to run in parallel until a specified number are running in parallel. The commands themselves take care of the running and processing of results, checking frequently to ensure the timeout threshold has not been passed.

The executor also keeps track of which commands are currently running, and how many are complete, and writes them to a file so that the overlord process can display useful information. Once complete, the executor returns the runtime information to the minion, which records the benchmark file. The executor will also safely shut itself down if the isi_gather_info lock file disappears, such as if the isi_gather_info process is killed.

During a gather the minion returns nothing to the overlord process, since the output of its work is written to disk.

Architecturally, the ‘gather’ process comprises an eight phase workflow:

The details of each phase are as follows:

Phase Description
1.       Setup Reads from the arguments passed in, as well as any config files on disk, and sets up the config dictionary, which will be used throughout the rest of the codebase. Most of the code for this step is contained in isilon/lib/python/gather/igi_config/configuration.py. This is also the step where the program is most likely to exit, if some config arguments end up being invalid
2.       Run local Executes all the cluster commands, which are run on the same node that is starting the gather. All these commands run in parallel (up to the current parallelism value). This is typically the second longest running phase.
3.       Run nodes Executes the node commands across all of the cluster’s nodes. This runs on each node, and while these commands run in parallel (up to the current parallelism value), they do not run in parallel with the local step.
4.       Collect Ensures all of the results end up on the overlord node (the node that started gather). If gather is using /ifs, it is very fast, but if it’s not, it needs to SCP all the node results to a single node.
5.       Generate Extra Files Generates nodes_info and package_info.xml. These are two files that are present in every single gather, and tell us some important metadata about the cluster
6.       Packing Packs (tars and gzips) all the results. This is typically the longest running phase, often by an order of magnitude
7.       Upload Transports the tarfile package to its specified destination. Depending on the geographic location this phase might also be a lengthy duration.
8.       Cleanup Cleanups any intermediary files that were created on cluster. This phase will run even if gather fails, or is interrupted.

Since the isi_gather_info tool is primarily intended for troubleshooting clusters with issues, it runs as root (or compadmin in compliance mode), as it needs to be able to execute under degraded conditions (eg. without GMP, during upgrade, and under cluster splits, etc). Given these atypical requirements, isi_gather_info is built as a stand-alone utility, rather than using the platform API for data collection.

The time it takes to complete a gather is typically determined by cluster configuration, rather than size. For example, a gather on a small cluster with a large number of NFS shares will take significantly longer than on large cluster with a similar NFS configuration. Incremental gathers are not recommended, since the base that’s required to check against in the log store may be deleted. By default, gathers only persist for two weeks in the log processor.

On completion of a gather, a tar’d and zipped logset is generated and placed under the cluster’s /ifs/data/IsilonSupport/pkg directory by default. A standard gather tarfile unpacks to the following top-level structure:

# du -sh *

536M    IsilonLogs-powerscale-f900-cl1-20220816-172533-3983fba9-3fdc-446c-8d4b-21392d2c425d.tgz

320K    benchmark

 24K    celog_events.xml

 24K    command_line

128K    complete

449M    local

 24K    local.log

 24K    nodes_info

 24K    overlord.log

 83M    powerscale-f900-cl1-1

 24K    powerscale-f900-cl1-1.log

119M    powerscale-f900-cl1-2

 24K    powerscale-f900-cl1-2.log

134M    powerscale-f900-cl1-3

 24K    powerscale-f900-cl1-3.log

In this case, for a three node F900 cluster, the compressed tarfile is 536 MB in size. The bulk of the data, which is primarily CLI command output, logs and sysctl output, is contained in the ‘local’ and individual node directories (powerscale-f900-cl1-*). Each node directory contains a tarfile, varlog.tar, containing all the pertinent logfiles for that node.

In the root directory of the tarfile file includes the following:

Item Description
benchmark §  Runtimes for all commands executed by the gather.
celog_events.xml ·         Info about the customer, including, name, phone, email, etc.

·         Contains significant about the cluster and individual nodes, including:

§  Cluster/Node names

§  Node Serial numbers

§  Configuration ID

§  OneFS version info

§  Events

command_line ·         Syntax of gather commands run.
complete §  Lists of complete commands run across the cluster and on individual nodes
local ·         See below.
nodes_info ·         Contains general information about the nodes, including the node ID, the IP address, the node name, and the logical node number
overlord.log §  Gather execution and issue log.
package_info.xml §  Cluster version details, GUID, S/N, and customer info (name, phone, email, etc).

Notable contents of the ‘local’ directory (all the cluster-wide commands that are executed on the node running the gather) include:

Local Contents Item Description
isi_alerts_history


·         This file seems to contain a list of all alerts that have ever occurred on the cluster

·         Event Id, which consists of the number of the initiating node and the event number

·         Times that the alert was issued and was resolved

·         Severity

·         Logical Node Number of the node(s) to which the alert applies

·         The message contained in the alert

isi_job_list ·         Contains information about job engine processes

·         Includes Job names, enabled status, priority policy, and descriptions

isi_job_schedule ·         A schedule of when job engine processes run

·         Includes job name, the schedule for a job, and the next time that a run of the job will occur

isi_license ·         The current license status of all of the modules
isi_network_interfaces §  State and configuration of all the cluster’s network interfaces.
isi_nfs_exports §  Configuration detail for all the cluster’s NFS exports.
isi_services §  Listing of all the OneFS services and whether they are enabled or disabled. More detailed configuration for each service is contained in separate files. Ie. For SnapshotIQ:

o   snapshot_list

o   snapshot_schedule

o   snapshot_settings

o   snapshot_usage

o   writable_snapshot_list

isi_smb §  Detailed configuration info for all the cluster’s NFS exports.
isi_stat §  Overall status of the cluster, including networks, drives, etc.
isi_statistics §  CPU, protocol, and disk IO stats.

Contents of the directory for the ‘node’ directory include:

Node Contents Item Description
df ·         output of the df command
du ·         Output of the du command

·         Unfortunately it runs ‘du -h’ which reports capacity in ‘human readable’ for, but make it more complex to sort.

isi_alerts ·         Contains a list of outstanding alerts on the node
ps and ps_full lists of all running process at the time that isi_gather_info was executed.

As the isi_gather_info command runs, status is provided via the interactive CLI session:

# isi_gather_info

Configuring

    COMPLETE

running local commands

    IN PROGRESS \

Progress of local

[########################################################  ]

147/152 files written  \

Some active commands are: ifsvar_modules_jobengine_cp, isi_statistics_heat, ifsv

ar_modules

Once the gather has completed, the location of the tarfile on the cluster itself is reported as follows:

# isi_gather_info

Configuring

    COMPLETE

running local commands

    COMPLETE

running node commands

    COMPLETE

collecting files

    COMPLETE

generating package_info.xml

    COMPLETE

tarring gather

    COMPLETE

uploading gather

    COMPLETE

Path to the tar-ed gather is:

/ifs/data/Isilon_Support/pkg/IsilonLogs-h5001-20220830-122839-23af1154-779c-41e9-b0bd-d10a026c9214.tgz

If the gather upload services are unavailable, errors will be displayed on the console, per below:

…

uploading gather

    FAILED

        ESRS failed - ESRS has not been provisioned

        FTP failed - pycurl error: (28, 'Failed to connect to ftp.isilon.com port 21 after 81630 ms: Operation timed out')

OneFS Deadlocks and Hang-dumps – Part 3

As we’ve seen previously in this series, very occasionally a cluster can become deadlocked and remain in an unstable state until the affected node(s), or sometimes the entire cluster, is rebooted or panicked. However, in addition to the data gathering discussed in the prior article, there are additional troubleshooting steps that can be explored by the more adventurous cluster admin – particularly with regard to investigating a LIN lock.

Lock Domain Resource Description
LIN LIN Every object in the OneFS filesystem (file, directory, internal special LINs) is indexed by a logical inode number (LIN). A LIN provides an extra level of indirection, providing pointers to the mirrored copies of the on-disk inode. This domain is used to provide mutual exclusion around classic BSD vnode operations. Operations that require a stable view of data take a read lock which allows other readers to operate simultaneously but prevents modification. Operations that change data take a write lock that prevents others from accessing that directory while the change is taking place.

 The approach outlined can be useful to assist in identifying the problematic thread(s) and/or node(s) and helping to diagnose and resolve a cluster wide deadlock.

As a quick refresher, the various OneFS locking components include:

Locking Component Description
Coordinator A coordinator node arbitrates locking within the cluster for a particular subset of resources. The coordinator only maintains the lock types held and wanted by the initiator nodes.
Domain Refers to the specific lock attributes (recursion, deadlock detection, memory use limits, etc) and context for a particular lock application. There is one definition of owner, resource, and lock types, and only locks within a particular domain may conflict.
Initiator The node requesting a lock on behalf of a thread is called an initiator. The initiator must contact the coordinator of a resource in order to acquire the lock. The initiator may grant a lock locally for types which are subordinate to the type held by the node. For example, with shared-exclusive locking, an initiator which holds an exclusive lock may grant either a shared or exclusive lock locally.
Lock Type Determines the contention among lockers. A shared or read lock does not contend with other types of shared or read locks, while an exclusive or write lock contends with all other types. Lock types include: Advisory, Anti-virus, Data, Delete, LIN, Mark, Oplocks, Quota, Share Mode, SMB byte-range, Snapshot, and Write.
Locker Identifies the entity which acquires a lock.
Owner A locker which has successfully acquired a particular lock. A locker may own multiple locks of the same or different type as a result of recursive locking.
Resource Identifies a particular lock. Lock acquisition only contends on the same resource. The resource ID is typically a LIN to associate locks with files.
Waiter Has requested a lock but has not yet been granted or acquired it.

So the basic data that will be required for a LIN lock investigation is as follows:

Data Description
<Waiter-LNN> Node number with the largest ‘started’ value.
<Waiting-Address> Address of <Waiter-LNN> node above.
<LIN> LIN from the ‘resource = field of <Waiter-LNN>
<Block-Address> Block address from “resource=’ field of <Waiter-LNN>
<Locker-Node> Node that owns the lock for the <LIN>. Has a non-zero value for ‘owner_count.
<Locker-Address) Address of Locker-Node.

As such, the following process can be used to help investigate a LIN lock:

The details for each step above are as follows:

  1. First, execute the following CLI syntax from any node in the cluster to view the LIN lock.’oldest_waiter’ infol:
# isi_for_array -X 'sysctl efs.lin.lock.initiator.oldest_waiter | grep -E "address|started"' | grep -v "exited with status 1"

Querying the ‘efs.lin.lock.initiator.oldest_waiter’ sysctl returns a deluge of information, for example:

# sysctl efs.lin.lock.initiator.oldest_waiter

efs.lin.lock.initiator.oldest_waiter: resource = 1:02ab:002c

waiter = {

    address = 0xfffffe8ff7674080

    locker = 0xfffffe99a52b4000

    type = shared

    range = [all]

    wait_type = wait ok

    refcount_type = stacking

    probe_id = 818112902

    waiter_id = 818112902

    probe_state = done

    started = 773086.923126 (29.933031 seconds ago)

    queue_in = 0xfffff80502ff0f08

    lk_completion_callback = kernel:lk_lock_callback+0

    waiter_type = sync

    created by:

      Stack: --------------------------------------------------

      kernel:lin_lock_get_locker+0xfe

      kernel:lin_lock_get_locker+0xfe

      kernel:bam_vget_stream_invalid+0xe5

      kernel:bam_vget_stream_valid_pref_hint+0x51

      kernel:bam_vget_valid+0x21

      kernel:bam_event_oprestart+0x7ef

      kernel:ifs_opwait+0x12c

      kernel:amd64_syscall+0x3a6

      --------------------------------------------------

The pertinent areas of interest for this exercise are the ‘address’ and ‘started’ (wait time) fields.

If the ‘started’ value is short (ie. less than 90 seconds), or there is no output returned, then this is potentially an MDS lock issue (which can be investigated via the ‘efs.mds.block_lock.initiator.oldest_waiter’ sysctl).

  1. From the above output, examine the results with ‘started’ lines and find the one with the largest value for ‘(###.### seconds ago)’. The node number (<Waiter-LNN>) of this entry is the one of interest.
  2. Next, examine the ‘address =’ entries and find the one with that same node number (<Waiting-Address>).

Note that if there are multiple entries per node, this could indicate a multiple shared lock with another exclusive lock waiting.

  1. Query the LIN for the waiting address on the correct node using the following CLI syntax:
# isi_for_array -n<Waiter-LNN> 'sysctl efs.lin.lock.initiator.active_entries | egrep "resource|address|owner_count" | grep -B5 <Waiting-Address>'
  1. The LIN for this issue is shown in the ‘resource =’ field from the above output. Use the following command to find which node owns the lock on that LIN:
# isi_for_array -X 'sysctl efs.lin.lock.initiator.active_entries |egrep "resource|owner_count"' | grep -A1 <LIN>

Parse the output from this command to find the entry that has a non-zero value for ‘owner_count’. This is the node that owns the lock for this LIN (<Locker-Node>).

  1. Run the following command to find which thread owns the lock on the LIN:
# isi_for_array -n<Locker-Node> 'sysctl efs.lin.lock.initiator.active_entries | grep -A10 <LIN>'
  1. The ‘locker =’ field will provide the thread address (<Locker-Addr>) for the thread holding the lock on the LIN. The following CLI syntax can be used to find the associated process and stack details for this thread:
    # isi_for_array -n<Locker-Node>'sysctl kern.proc.all_stacks |grep -B1 -A20 <Locker-Addr>'
  2. The output will provide the stack and process details. Depending on the process and stack information available from the previous command output, you may be able to terminate (ie. kill -9) the offending process in order to clear the deadlock issue.

Usually within a couple of minutes of killing the offending process, the cluster will become responsive again. The ‘isi get -L’ CLI command can be used to help determine which file was causing the issue, possibly giving some insight as to the root cause.

Please note that if you are unable to identify an individual culprit process, or are unsure of your findings, contact Dell Support for assistance.

OneFS Deadlocks and Hang-dumps – Part 2

As mentioned in the previous article in this series, hang-dumps can occur under the following circumstances.

Type Description
Transient The time to obtain the lock was long enough to trigger a hang-dump, but the lock is eventually granted. This is the less serious situation. The symptoms are typically general performance degradation, but the cluster is still responsive and able to progress.
Persistent The issue typically requires significant remedial action, such as node reboots. This is usually  indicative of a bug in OneFS, although it could also be caused by hardware issues, where hardware becomes unresponsive, and OneFS waits indefinitely for it to recover.

Certain normal OneFS operations, such as those involving very large files, have the potential to trigger a hang-dump with no long-term ill effects. However, in some situations the thread or process waiting for the lock to be freed, or ‘waiter’, is never actually granted the lock on the file. In such cases, users may be impacted.

If a hang-dump is generated as a result of a LIN lock timeout  (the most likely scenario), this indicates that at least one thread in the system has been waiting for a LIN lock for over 90 seconds. The system hang can involve a single thread, or sometimes multiple threads, for example blocking a batch job. The system hang could be affecting interactive session(s), in which case the affected cluster users will likely experience performance impacts.

Specifically, in the case of a LIN lock timeout, if the LIN number is available, it can be easily mapped back to its associated filename using the ‘isi get’ CLI command.

# isi get -L <lin #>

However, a LIN which is still locked may necessitate waiting until the lock is freed before getting the name of the file.

By default, OneFS hang-dump files are written to the /var/crash directory as compressed text files. During a hang-dump investigation, Dell support typically utilizes internal tools to analyze the logs from all of the nodes and generate a graph to show the lock interactions between the lock holders (the thread or process that is holding the file) and lock waiters. The analytics are per-node and include a full dump of the lock state as seen by the local node, the stack of each thread in the system, plus a variety of other diagnostics including memory usage, etc. Since OneFS source-code access is generally required in order to interpret the stack traces, Dell Support can help investigate the hang-dump log file data, which can then be used to drive further troubleshooting.

A deadlocked cluster may exhibit one or more of the following symptoms:

  • Clients are unable to communicate with the cluster via SMB, NFS, SSH, etc.
  • The WebUI is unavailable and/or commands executed from the CLI fail to start or complete.
  • Processes cannot be terminated, even with SIGKILL (kill -9).
  • Degraded cluster performance is experienced, with low or no CPU/network/disk usage.
  • Inability to access files or folders under /ifs.

In order to recover from a deadlock, Dell support’s remediation will sometimes require panicking or rebooting a cluster. In such instances, thorough diagnostic information gathering should be performed prior to this drastic step. Without this diagnostic data, it will be often be impossible to determine the root cause of the deadlock. If the underlying cause of the deadlock is not corrected, rebooting the cluster and restarting the service may not resolve the issue.

The following steps can be run in order to gather data that will be helpful in determining the cause of a deadlock:

  1. First, verify that there are no indeterminate journal transactions. If there are indeterminate journal transactions found, rebooting or panicking nodes will not resolve the issue.
# isi_for_array -X 'sysctl efs.journal.indeterminate_txns'

1: efs.journal.indeterminate_txns: 0
2: efs.journal.indeterminate_txns: 0
3: efs.journal.indeterminate_txns: 0

For each node, if the output of the above command returns zero, this indicates its journal is intact and all transactions are complete. Note that if the output is anything other than zero, the cluster contains indeterminate transactions, and Dell support should be engaged before any further troubleshooting is performed.

2. Next, check the /var/crash/directory for any recently created hang-dump files:

# isi_for_array -s 'ls -l /var/crash | grep -i hang'

Scan the /var/log/messages/ file for any recent references to ‘LOCK TIMEOUT’.

# isi_for_array -s 'egrep -i "lock timeout|hang" /var/log/messages | grep $(date +%Y-%m-%d)'

3.Collect the output from the ‘fstat’ CLI command, which identifies active files:

# isi_for_array -s 'fstat -m > /ifs/data/Isilon_Support/deadlock-data/fstat_$(hostname).txt'&

4. Record the Group Management Protocol (GMP) merge lock state:

# isi_for_array -s 'sysctl efs.gmp.merge_lock_state > /ifs/data/Isilon_Support/deadlock-data/merge_lock_state_$(hostname).txt'

5. Finally, run an ‘isi diagnostics gather’ logset gather to capture relevant cluster data and send the resulting zipped tarfile to Dell Support (via ESRS, FTP, etc).

# isi diagnostics gather start

A cluster reboot can be accomplished via an SSH connection as root to any node in the cluster, as follows:

# isi config

Welcome to the PowerScale configuration console.

Copyright (c) 2001-2022 Dell Inc. All Rights Reserved.

Enter 'help' to see list of available commands.

Enter 'help <command>' to see help for a specific command.

Enter 'quit' at any prompt to discard changes and exit.

        Node build: Isilon OneFS 9.4.0.0 B_MAIN_2978(RELEASE)

        Node serial number: JACNT194540666

TME1 >>> reboot all
 

!! You are about to reboot the entire cluster

Are you sure you wish to continue? [no] yes

Alternatively, the following CLI syntax can be used to reboot a single node from an SSH connection to it:

# kldload reboot_me

Or to reboot the cluster:

# isi_for_array -x$(isi_nodes -L %{lnn}) 'kldload reboot_me'

Note that simply shutting down or rebooting the affected node(s), or the entire cluster), while typically the quickest path to get up and running again, will not generate the core files required for debugging. If a root cause analysis is desired, these node(s) will need to be panicked in order to generate a dump of all active threads.

Only perform a node panic under the direct supervision of Dell Support! Be aware that panics bypass a number of important node shutdown functions, including unmounting /ifs, etc. However, a panic will generate additional kernel core information which is typically required by Dell Support in order to perform a thorough diagnosis. In situations where the entire cluster needs to be panicked, the recommendation is to start with the highest numbered node and work down to lowest. For each node that’s panicked, the debug information is written to the /var/crash directory, and can be identified by the ‘vmcore’ prefix.

If instructed by Dell Support to do so, the ‘isi_rbm_panic’ CLI command can be used to panic a node, with the argument being the logical node number (LNN) of the desired node to target. For example, to panic a node with LNN=2:

# isi_rbm_panic 2

If in any doubt, the following CLI syntax will return the corresponding node ID and node LNN for each node in the cluster:

# isi_nodes %{id} , %{lnn}

OneFS Deadlocks and Hang-dumps

A principal benefit of the OneFS distributed file system is its ability to efficiently coordinate operations that happen on separate nodes. File locking enables multiple users or processes to access data concurrently and safely. Since all nodes in an PowerScale cluster operate on the same single-namespace file system simultaneously, it requires mutual exclusion mechanisms to function correctly. For reading data, this is a fairly straightforward process involving shared locks. With writes, however, things become more complex and require exclusive locking, since data must be kept consistent.

Under the hood, the locks OneFS uses to provide consistency inside the file system (internal) are separate from the file locks provided for consistency between applications (external). This allows OneFS to reallocate a file’s metadata and data blocks while the file itself is locked by an application. This is the premise of OneFS autobalance, reprotection and tiering, where restriping is performed behind the scenes in small chunks, in order to minimize disruption.

OneFS has a fully distributed lock manager (DLM) that marshals locks across all the nodes in a cluster. This locking manager allows for multiple lock types to support both file system locks as well as cluster-coherent protocol-level locks, such as SMB share mode locks or NFS advisory-mode locks. The DLM distributes the lock data across all the nodes in the cluster. In a mixed cluster, the DLM will balance the memory utilization so that the lower-power nodes are not bullied.

OneFS includes the following lock domains:

Lock Domain Resource Description
Advisory Lock LIN The advisory lock domain (advlock) implements local POSIX advisory locks and NFS NLM locks.
Anti-virus LIN, snapID The AV domain implements locks used by OneFS’ ICAP Antivirus feature.
Data LIN, LBN The datalock lock domain implements locks on regions of data within a file. By reducing the locking granularity to below the file level, this enables simultaneous writers to multiple sections of a single file.
Delete LIN The ref lock domain exists to enable POSIX delete-on-close semantics. In a POSIX filesystem, unlinking an open file does not remove the space associated with the file until every thread accessing that file closes the file.
ID Map B-tree key The idmap database contains mappings between POSIX (uid, gid) and Windows (SID) identities. This lock domain provides concurrency control for the idmap database.
LIN LIN Every object in the OneFS filesystem (file, directory, internal special LINs) is indexed by a logical inode number (LIN). A LIN provides an extra level of indirection, providing pointers to the mirrored copies of the on-disk inode. This domain is used to provide mutual exclusion around classic BSD vnode operations. Operations that require a stable view of data take a read lock which allows other readers to operate simultaneously but prevents modification. Operations that change data take a write lock that prevents others from accessing that directory while the change is taking place.
MDS Lowest baddr All metadata in the OneFS filesystem is mirrored for protection. Operations involving read/write of such metadata are protected using locks in the Mirrored Data Structure (MDS) domain.
Oplocks LIN, snapID The Oplock lock domain implements the underlying support for opportunistic locks and leases.
Quota Quota Domain ID The Quota domain is used to implement concurrency control to quota domain records.
Share mode LIN, snapID The share_mode_lock domain is used to implement the Windows share mode locks.
SMB byte-range (CBRL) The cbrl lock domain implements support for byte-range locking.

 Each lock type implements a set of key/value pairs, and can additionally support a ‘byte range’, or a pair of file offsets, and a ‘user data’ block.

In addition to managing locks on files, DLM also orchestrates access to the storage drives, too. Multiple domains, advisory file locks (advlock), mirrored metadata operations (MDS locks), and logical inode number (LIN locks) for operations involving file system objects that have an inode (ie. files or directories) exist within the lock manager. Within these, LIN locks constitute the lion’s share of OneFS locking issues.

Much like OS-level locking, DLM’s operations are typically invisible to end users. That said, DLM sets a maximum time to wait to obtain a lock. When this threshold is exceeded, OneFS automatically triggers a diagnostic information-gathering process, or hang-dump. Note that the triggering of a hang-dump is not necessarily indicative of an issue, but should definitely prompt some further investigation. Hang-dumps will be covered in more depth in a forthcoming blog article in this series.

So what exactly is deadlock? When one or more processes have obtained locks on resources, a point can be reached in which each process prevents another from obtaining a lock, rendering none of the processes able to proceed. This condition is known as a deadlock.

In the image above, thread 1 has an exclusive lock on Resource A, but also requires Resource B in order to complete execution. Since the Resource B lock is unavailable, thread 1 will have to wait for thread 2 to release it’s lock on Resource B. At the same time, thread 2 has obtained an exclusive lock on Resource B, but requires Resource A for finishing execution. Since the Resource A lock is unavailable, if thread 2 attempts to lock Resource A, both processes will wait indefinitely for each other.

Any multi-process file system architecture that involves locking has the potential for deadlocks if any thread needs to acquire more than one lock at the same time. There are typically two general approaches to handling this scenario:

Option Description
Avoidance Attempt to ensure the code cannot deadlock. This approach involves mechanisms such as consistently acquiring locks in the same order. This approach is generally challenging, not always practical, and can have adverse performance implications for the fast path code.
Acceptance Acknowledge that deadlocks will occur and develop appropriate handling methods.

While OneFS ultimately takes the latter approach, it strives to ensure that deadlocks don’t occur. However, under rare conditions, it is more efficient to manage deadlocks by simply breaking and reestablishing the locks.

In OneFS parlance, a ‘hang-dump’ is a cluster event, resulting from a cluster detecting  a ‘hang’ condition, during which the isi_hangdump_d service generates a set of log files. This typically occurs as a result of merge lock timeouts and deadlocks, and while hang-dumps are typically triggered automatically, they can also be manually initiated if desired.

OneFS monitors each lock domain and has a built-in ‘soft timeout’ (the amount of time in which OneFS can generally be expected to satisfy a lock request) associated with each. If a thread holding a lock blocks another thread’s attempt to obtain a conflicting lock type for longer than the soft timeout period, a hang-dump is triggered to collect a substantial quantity of system state information for potential diagnostic purposes, including the lock state of each domain, plus the stack traces of every thread on each node in the cluster.

When a thread is blocked for an extended period of time, any client that is waiting for the work that the thread is performing is also blocked. The external symptoms resulting from this can include:

  • Open applications stop taking input but do not shut down.
  • Open windows or dialogues cannot be closed.
  • The system cannot be restarted normally because  it does not respond to commands.
  • A node does not respond to client requests.

Hang-dumps can occur as a result of the following conditions:

Type Description
Transient The time to obtain the lock was long enough to trigger a hang-dump, but the lock is eventually granted. This is the less serious situation. The symptoms are typically general performance degradation, but the cluster is still responsive and able to progress.
Persistent The issue typically requires impactful remedial action, such as node reboots. This is usually  indicative of either a defect or bug in OneFS or hardware issue, where a cluster component becomes unresponsive, and OneFS waits indefinitely for it to recover.

Note that a OneFS hang-dump is not necessarily indicative of a serious issue.

OneFS System Logging and Ilog

The OneFS ilog service is a general logging facility for the cluster, allowing applications and services to rapidly decide if or where to log messages, based on the currently active logging configuration. Historically, OneFS used syslog directly or via custom wrappers, and the isi_ilog daemon provides features common to those wrappers plus an array of other capabilities. These include runtime-modification, the ability to log to file, syslog, and or stderr, additional context including message plus ‘component’, ‘job’, and ‘thread_id’, and default fall-back to syslog.

Under the hood, there are actually two different ilog components; kernel ilog and userspace ilog.

Kernel ilog controls log verbosity at runtime, avoids installing a new kernel module to enable more log detail, and allows only enabling such detailed logging at certain times. Ilog defines six logging levels: Error, Warning, Notice, Info, Debug, and Trace, with levels ‘error’, ‘warning’ and ‘notice’ being written to /var/log/messages with the default configuration. The user interface to kernel Ilog is through sysctl variables, each of which can be set to any combination of the logging levels.

Userspace ilog, while conceptually similar to the kernel implementation, lacks single memory space and per-boot permanence of sysctl variables. User-space processes may start and terminate arbitrarily, and there may also be multiple processes running for a given service or app. Consequently, user-space ilog uses a gconfig file and shared memory to implement run-time changes to logging levels.

Runtime control of OneFS services’ logging is via the ‘isi_ilog’ CLI tool, which enables:

  • Adjusting logging levels
  • Defining tags which enable log lines with matching tags
  • Logging by file or file and line number
  • Adding or disabling logging to a file
  • Enabling or disabling logging to syslog
  • Throttling of logging so repeated messages aren’t emitted more than N seconds apart.

For userspace log, when an application or service using ilog starts up, its logging settings are loaded from the ilog gconfig tree, and a small chunk of shared memory is opened and logically linked to that config. When ilog’s logging configuration is modified via the CLI, the gconfig tree is updated and a counter in the shared memory incremented.

The OneFS applications and services that are currently integrated with ilog include:

Service Daemons
API PAPI, isi_rsapi_d
Audit isi_audit_d, isi_audit_syslog, isi_audit_purge_helper
Backend network isi_lbfo_d
CloudPools isi_cpool_d
Cluster monitoring isi_array_d, isi_paxos
Configuration store isi_tardis_d, isi_tardis_gcfg_d
DNS isi_dnsiq_d   isi_cbind_d
Drive isi_drive_d, isi_drive_repurpose_d
Diagnostics isi_diags_d
Fast delete isi_trash_d
Healthchecks isi_protohealth_d
IPMI management isi_ipmi_mgmt_d
Migration isi_vol_copy, isi_retore
NDMP Backup isi_ndmp_d
NFS isi_nfs_convert, isi_netgroup_d
Remote assist isi_esrs_d, isi_esrs_api
SED Key Manager isi_km_d
Services manager isi_mcp_d
SmartLock Compliance isi_comp_d
SmartSync isi_dm_d
SyncIQ siq_bandwidth, siq_generator, siq_pworker, siq_pworker_hasher, siq_stf_diff, siq_sworker, siq_sworker_hasher, siq_sworker_tmonitor, siq_coord, siq_sched, siq_sched_rotate_reports
Upgrade Signing isi_catalog_init

The ilog logging level provides for three types of capabilities:

  1. Severity (which maps to syslog severity)
  2. Special
  3. Custom

Plus the ilog severity level settings are as follows: 

Ilog Severity Level Syslog Mapping
IL_FATAL Maps to LOG_CRIT. Calls exit after message is logged.
IL_ERR Maps to LOG_ERR
IL_NOTICE Maps to LOG_INFO
IL_INFO Maps to LOG_INFO
IL_DEBUG Maps to LOG_DEBUG
IL_TRACE Maps to LOG_DEBUG

For example, the following CLI command will set the NDMP service to log at the ‘info’ level:

# isi_ilog -a isi_ndmp_d --level info

Note that logging levels do not work quite like syslog, as each level is separate. Specifically, if an application’s criteria set to log messages with the ‘IL_DEBUG level’ it will only log those debug messages, and not log messages at any higher severity. To log at a level and all higher severity levels, ilog allows ‘PLUS’ (–level <level>+)  combination settings.

Logging configuration is per named application, not per process, and settings are managed on a per-node basis. Any cluster-wide ilog criteria changes will require the use of the ‘isi_for_array’ CLI utility.

Be aware that syslog is still the standard target for logging and  /etc/mcp/templates/syslog.conf (rather than /etc/syslog.conf) is used to enable sysloging. If ‘use_syslog’ is set to true, but syslog.conf is not modified, syslog entries will not be created. When syslog is enabled, if ‘log_file’ points to the same syslog file, duplicate log entries will occur, one from syslog and one from the log file.

Other isi_log CLI commands include:

List all apps:

# isi_ilog -L

Print settings for an app:

# isi_ilog -a <service_name> -p

Set application level to info:

# isi_ilog -a <service_name> --level info

Turn off syslog logging for application:

# isi_ilog -a <service_name> --syslog off

Turn on logging to a file for a service:

# isi_ilog -a <service_name> --file /ifs/logs/<service_name>.log

Of the various services that use ilog, OneFS auditing is among the most popular. As such, it has its own configuration through the ‘isi audit’ CLI command set, or from the WebUI via Cluster management > Auditing:

Additionally, the ‘audit setting global’ CLI command allows is used to enable and disable cluster auditing, as well as configure retention periods, remote CEE and syslog services, etc.

# isi audit settings global view

Protocol Auditing Enabled: Yes

            Audited Zones: System, az1

          CEE Server URIs: -

                 Hostname:

  Config Auditing Enabled: Yes

    Config Syslog Enabled: Yes

    Config Syslog Servers: 10.20.40.240

  Protocol Syslog Servers: 10.20.40.240

     Auto Purging Enabled: No

         Retention Period: 180

Additionally, the various audit event attributes can be viewed and modified via the ‘isi audit settings’ CLI command.

# isi audit settings view

            Audit Failure: create_file, create_directory, open_file_write, open_file_read, close_file_unmodified, close_file_modified, delete_file, delete_directory, rename_file, rename_directory, set_security_file, set_security_directory

            Audit Success: create_file, create_directory, open_file_write, open_file_read, close_file_unmodified, close_file_modified, delete_file, delete_directory, rename_file, rename_directory, set_security_file, set_security_directory

      Syslog Audit Events: create_file, create_directory, open_file_write, open_file_read, close_file_unmodified, close_file_modified, delete_file, delete_directory, rename_file, rename_directory, set_security_file, set_security_directory

Syslog Forwarding Enabled: Yes

To configure syslog forwarding, review the zone specific audit settings and ensure syslog audit events (for local) are set and syslog forwarding is enabled (for remote).

Note that the ‘isi audit settings’ CLI command defaults to the ‘system’ zone unless the ‘–zone’ flag is specified. For example, to view the configuration for the ‘az1’ access zone, which in this case is set to non-forwarding:

# isi audit settings view --zone=az1

            Audit Failure: create_file, create_directory, open_file_write, open_file_read, close_file_unmodified, close_file_modified, delete_file, delete_directory, rename_file, rename_directory, set_security_file, set_security_directory

            Audit Success: create_file, create_directory, open_file_write, open_file_read, close_file_unmodified, close_file_modified, delete_file, delete_directory, rename_file, rename_directory, set_security_file, set_security_directory

      Syslog Audit Events: create_file, create_directory, open_file_write, open_file_read, close_file_unmodified, close_file_modified, delete_file, delete_directory, rename_file, rename_directory, set_security_file, set_security_directory

Syslog Forwarding Enabled: No

The cluster’s /etc/syslog.conf file should include the IP address of the server that’s being forwarded to (in this example, a Linux box at 10.20.40.240):

!audit_config

*.*                                             /var/log/audit_config.log

*.*                                             @10.20.40.240

!audit_protocol

*.*                                             /var/log/audit_protocol.log

*.*                                             @10.20.40.240

Output on the remote host will be along the lines of:

Jul 31 17:46:40 isln-tme-1(id1) audit_protocol[2188] S-1-22-1-0|0|System|1|10.20.40.1|SMB|OPEN|SUCCESS|1442207|FILE|CREATED|4314890714|/ifs/test/audit_test2.doc

Jul 31 17:46:43 isln-tme-1(id1) audit_protocol[2188] S-1-22-1-0|0|System|1|10.20.40.1|SMB|CLOSE|SUCCESS|FILE|0:0|0:0|4314890714|/ifs/test/audit_test2.doc

Jul 31 17:46:43 isln-tme-1(id1) audit_protocol[2188] S-1-22-1-0|0|System|1|10.20.40.1|SMB|OPEN|SUCCESS|129|FILE|OPENED|4314890714|/ifs/test/audit_test2.doc

Jul 31 17:46:43 isln-tme-1(id1) audit_protocol[2188] S-1-22-1-0|0|System|1|10.20.40.1|SMB|CLOSE|SUCCESS|FILE|0:0|0:0|4314890714|/ifs/test/audit_test2.doc.txt

Jul 31 17:46:43 isln-tme-1(id1) audit_protocol[2188] S-1-22-1-0|0|System|1|10.20.40.1|SMB|RENAME|SUCCESS|FILE|4314890714|/ifs/test/ audit_test2.doc.txt|/ifs/test/audit_test.txt

Jul 31 17:46:44 isln-tme-1(id1) audit_protocol[2188] S-1-22-1-0|0|System|1|10.20.40.1|SMB|OPEN|FAILED:3221225524|129|FILE|DOES_NOT_EXIST||/ifs/test/audit_test2.doc

Jul 31 17:46:45 isln-tme-1(id1) audit_protocol[2188] S-1-22-1-0|0|System|1|10.20.40.1|SMB|CLOSE|SUCCESS|FILE|0:0|0:0|4314890714|/ifs/test/audit_test2.doc

Jul 31 17:46:45 isln-tme-1(id1) audit_protocol[2188] S-1-22-1-0|0|System|1|10.20.40.1|SMB|OPEN|SUCCESS|1179785|FILE|OPENED|4314890714|/ifs/test/audit_test3.txt

Jul 31 17:46:45 isln-tme-1 (id1) audit_protocol[2188] S-1-22-1-0|0|System|1|10.20.40.1|SMB|CLOSE|SUCCESS|FILE|0:0|0:0|4314890714|/ifs/test/audit_test3.txt

Jul 31 17:46:45 isln-tme-1 syslogd last message repeated 6 times

Jul 31 17:46:51 isln-tme-1 (id1) audit_protocol[2188] S-1-22-1-0|0|System|1|10.20.40.1|SMB|OPEN|SUCCESS|1180063|FILE|OPENED|4314890714|/ifs/test/audit_test3.txt

Jul 31 17:46:51 isln-tme-1 (id1) audit_protocol[2188] S-1-22-1-0|0|System|1|10.20.40.1|SMB|CLOSE|SUCCESS|FILE|0:0|0:0|4314890714|/ifs/test/audit_test3.txt

Jul 31 17:46:51 isln-tme-1(id1) audit_protocol[2188] S-1-22-1-0|0|System|1|10.20.40.1|SMB|CLOSE|SUCCESS|FILE|0:0|5:1|4314890714|/ifs/test/audit_test3.txt

OneFS and QLC Drive Support

Another significant feature of the recent OneFS 9.4 release is support for quad-level cell (QLC) flash media. Specifically, the PowerScale F900 and F600 all-flash NVMe platforms are now available with 15.4TB and 30.7TB QLC NVMe drives.

These new QLC drives offer the gamut of capacity, performance, reliability and affordability – and will be particularly beneficial for workloads such as artificial intelligence, machine and deep learning, and for media and entertainment environments.

The details of the new QLC drive options for the F600 and F900 platforms are as follows:

PowerScale Node Chassis specs

(per node)

Raw capacity

(per node)

Max Raw capacity
(252 node cluster)
F900 2U with 24 NVMe SSD drives 737.28TB with 30.72TB QLC

368.6TB with 15.36TB QLC

185.79PB with 30.72TB QLC

92.83PB with 15.36TB QLC

F600 1U with 8 NVMe SSD drives 245.76TB with 30.72TB QLC

122.88TB with 15.36TB QLC

61.93PB with 30.72TB QLC

30.96PB with 15.36TB QLC

This means an F900 cluster with the 30.7TB QLC drives can now scale up to a whopping 185.79PB in size, with a nice linear performance ramp!

So the new QLC drives double the all-flash capacity footprint, as compared to previous generations – while delivering robust environmental efficiencies in consolidated rack space, power and cooling. What’s more, PowerScale F600 and F900 nodes containing QLC drives can deliver the same level of performance as TLC drives, thereby delivering vastly superior economics and value. As illustrated below, QLC nodes performed at parity or slightly better than TLC nodes for throughput benchmarks and SPEC workloads.

The above graphs show the comparative peak random throughput per-node for both QLC and TLC.

QLC-based F600 and F900 nodes can easily be rapidly and non-disruptively integrated into existing PowerScale clusters, allowing seamless data lake expansion and accommodation of new workloads.

Compatibility-wise, there are a couple of key points to be aware of. If attempting to add a QLC drive to a non-QLC node, or vice versa, the unsupported drive will be blocked with the ‘WRONG_TYPE’ error. However, QLC and non-QLC nodes will happily coexist in different pools within the same cluster. But attempting to merge storage node pools with differing media classes will output the error ‘All nodes in the nodepool must have compatible [HDD|SSD] drive technology’.

From the WebUI, the ‘drive details’ pop-up window displays ‘NVME, SSD, QLC’ as the ‘Connection and media type’.  This can be viewed by navigating to Hardware configuration > Drives and selecting ‘View details’ for the desired drive:

The WebUI SmartPools summary, available by browsing to Storage pools > SmartPools, also incorporates ‘QLC’ into the pool name:

Similarly, in the ‘node pool details’:

From the OneFS CLI, existing commands displaying DSP (drive support package), PSI (platform support infrastructure), and storage and node pools display a new ‘media_class’ string, ‘QLC’. For example:

# isi storagepool nodepools ls

ID   Name                Nodes  Node Type IDs  Protection Policy  Manual

-------------------------------------------------------------------------

1    f600_15tb-ssd-qlc_736gb 1      1              +2d:1n             No

                         2

                         3

-------------------------------------------------------------------------

Total: 1


# isi storagepool nodetypes ls

ID   Product Name                               Nodes  Manual

--------------------------------------------------------------

1    F600-1U-Dual-736GB-2x25GE SFP+-15TB SSD QLC 1      No

                                                 2

                                                 3

--------------------------------------------------------------

Total: 1

OneFS 9.4 also introduces new model and vendor class fields, providing a dynamic and extensible path to determine what drive statistics and information to gather, how to capture them, and how to display them – in preparation for future drive technologies. For example:

# isi_radish -a

Bay 0/nvd15 is Dell Ent NVMe P5316 RI U.2 30.72TB FW:0.0.8 SN:BTAC1436043630PGGN, 60001615872 blks

Log Sense data (Bay 0/nvd15 ) –

Supported log pages 0x1 0x2 0x3 0x4 0x5 0x6 0x80 0x81

SMART/Health Information Log

============================

Critical Warning State: 0x00

Available spare: 0

Temperature: 0

Device reliability: 0

Read only: 0

Volatile memory backup: 0

Temperature: 297 K, 23.85 C, 74.93 F

Available spare: 100

Available spare threshold: 10

Percentage used: 0

Data units (512,000 byte) read: 1619199

Data units written: 10075777

Host read commands: 67060074

Host write commands: 4461942671

Controller busy time (minutes): 1

Power cycles: 21

Power on hours: 420

Unsafe shutdowns: 18

Media errors: 0

No. error info log entries: 0

Warning Temp Composite Time: 0

Error Temp Composite Time: 0

Temperature 1 Transition Count: 0

Temperature 2 Transition Count: 0

Total Time For Temperature 1: 0

Total Time For Temperature 2: 0

Finally, PowerScale F600 and F900 nodes must be running OneFS 9.4 and the latest DSP in order to support QLC drives. In the event of a QLC drive failure, it must be replaced with another QLC drive. Additionally, any attempts to downgrade a QLC node to a version prior to OneFS 9.4 will be blocked.

OneFS SmartSync Management and Diagnostics

In this final blog of this series, we’ll look at SmartSync’s diagnostic tools, performance, plus review some of its idiosyncrasies and coexistence with other OneFS features.

But first, performance. Unlike SyncIQ, which operates solely on a push model, SmartSync allows pull replication, too. This can be an incredibly useful performance option for environments that grow organically. As demand for replication on a source cluster increases, the additional compute and network load needs to be considered. Push replication, especially with multiple targets, can generate a significant load on the source cluster, as shown in CPU graphs in the following graphic:

In extreme cases, replication traffic resource utilization can potentially impact client workloads as data is pushed to the target. On the other hand, enabling  a pull replication model for a dataset can drastically reduce the resource impacts on the source cluster’s CPU utilization by offloading replication overhead to the target cluster. This can be seen in the following graphs:

For single-source dataset environments with numerous targets, pull replication can free up the source cluster’s compute and network resources, which can then be used more beneficially for client IO. However, if the target cluster is a capacity-optimized archive cluster without CPU and/or network resources to spare, a pull policy model, rather than the traditional push, may not be an option. In such cases, SmartSync also allows its policies to be limited, or throttled, in order to reduce system and/or network resource impacts from replication. SmartSync throttling come in two flavors: Bandwidth and CPU throttling.

  1. Bandwidth throttling is specified through a set of netmask rules plus a maximum throughput limit, and is configured via the ‘isi dm throttling’ CLI syntax:
# isi dm throttling bw-rules create NETMASK – [subnet] --bw-limit= command

Bandwidth limits are specified in bytes for a specific subnet and netmask. For example:

# isi dm throttling bw-rules create NETMASK --netmask 10.20.100.0/24 --bw-limit=$((20*1024*1024))

In this case, the bandwidth limit of 20MB (20*1024*1024 bytes) is applied to the 10.20.100.0 class C subnet. The throttling configuration change can be verified as follows:

# isi dm throttling bw-rules list

ID Rule Type Netmask Bw Limit

------------------------------------------

0 NETMASK 10.20.100.0/24 20.00MB

------------------------------------------

Total: 1


  1. Compute-wise, SmartSync policies by default can consume up to 30% of a node’s CPU cycles if its total CPU usage is less than 90%. If the node’s total CPU utilization reaches 90%, or if the SmartSync consumption reaches 30% of the total CPU, SmartSync automatically throttles its CPU consumption.

Additional CPU throttling is specified through ‘allowed CPU percentage’ and ‘backoff CPU percentage’ limits, which are also configured via the ‘isi dm throttling’ CLI command syntax.

The ‘allowed CPU Threshold’ paramater sets the always-allowed CPU cycles that SmartSync is allowed to use, regardless of the overall node CPU usage.  If system’s CPU usage crosses the ‘System CPU Load Threshold’ and SmartSync uses more than the ‘Allowed CPU Threshold’, it will then throttle CPU utilization to remain at or below the ‘Allowed CPU Threshold’.

For example, to set the allowed CPU threshold to 20% and the system CPU threshold to 80%:

# isi dm throttling settings view

    Allowed CPU Threshold: 30

System CPU Load Threshold: 90

# isi dm throttling settings modify --allowed-cpu-threshold 20 --system-cpu-load-threshold 80

# isi dm throttling settings view

    Allowed CPU Threshold: 20

System CPU Load Threshold: 80

Additionally, SmartSync performance is also aided by a scalable run-time engine, spanning the cluster, and which spins up threads (fibers) on demand and uses asynchronous IO to process replication tasks (chunks). Batch operations are used for efficient small file, attribute, and data block transfer. Namespace contention avoidance, efficient snapshot utilization, and separation of dataset creation from transfer are salient design features of the both the baseline and incremental sync algorithms. Plus, the availability of a pull transfer model can significantly reduce the impact on a source cluster, if needed.

On the caveats and considerations front, SmartSync v1 in OneFS 9.4 does have some notable limitations to be cognizant of. Notably, failover and failback of a SmartSync policy option is not currently supported, nor is an option to allow writes on the target cluster. However, the dataset is available for read and write on copy policies once the replication to the target platform is complete if the ‘–copy-createdataset-on-target=false’ option is specified. These limitations will be lifted in a future OneFS release. But for now, if required, repeat-copy data on the target platform may be copied out of the SmartSync data mover snapshot.

Other interoperability considerations include:

Component Interoperability
ADS/resource forked files With CloudCopy, only the main file stored; Alternate data stream/resource fork skipped when encountered.
Cloud copy-back Not supported unless data was created by a OneFS Datamover.
Cloud incrementals Unsupported for file->object transfers. One-time copy to/from cloud only.
CloudPools CloudPools Smartlink stub files are not supported.
Compression Compression for replication transfer is not supported.
Failover/failback policy Failover and failback option is not available, nor is an option to allow writes on the target cluster.
File metadata With CloudCopy, only POSIX UID, GID, atime, mtime, and ctime are copied.
File name encoding With CloudCopy, all encodings are converted to UTF-8.
Hadoop TDE SmartSync does not support the replication of the TDE domain and keys, rendering TDE encrypted data on the target cluster inaccessible.
Hard links With CloudCopy, hard links are not preserved, and a file/object is created for each link.
Inline data reduction Inline compressed and/or deduped data is rehydrated, decompressed, and transferred uncompressed to the target cluster.
Large files (4TB –> 16 TB) Supported up to the cloud provider’s maximum object size. SmartSync policies only connect with target clusters that also have large file support enabled.
RBAC SmartSync administrative access is assigned through the ISI_PRIV_DATAMOVER privilege
SFSE SFSE containerized small files are unpacked on the source cluster before replication.
SmartDedupe Deduplicated files are rehydrated back to their original size prior to replication.
SmartLock Compliance mode cluster are not supported with SmartSync.
SnapshotIQ Tightly integrated; uses snapshots for incrementals and re-baselining.
Sparse files With CloudCopy, sparse regions of files are written out as zeros.
Special files With CloudCopy, special files are skipped when encountered.
Symbolic links With CloudCopy, symlinks are skipped when encountered.
SyncIQ SmartSync and SyncIQ replication both happily coexist. An active SyncIQ license is required for both.

When it comes to monitoring and troubleshooting SmartSync, there are a variety of diagnostic tools available. These include:

Component Tools Issue
Logging ·         /var/log/isi_dm.log

·         /var/log/messages

·         ifs/data/Isilon_Support/datamover/transfer_failures/baseline_failures_ <jobid>

General SmartSync info and  triage.
Accounts ·         isi dm accounts list / view Authentication, trust and encryption.
CloudCopy ·         S3 Browser (ie. Cloudberry), Microsoft Azure Storage Explorer Cloud access and connectivity.
Dataset ·         isi dm dataset list/view Dataset creation and health.
File system ·         isi get Inspect replicated files and objects.
Jobs ·         isi dm jobs list/view

·         isi_datamover_job_status -jt

Job and task execution, auto-pausing, completion, control, and transfer.
Network ·         isi dm throttling bw-rules list/view

·         isi_dm network ping/discover

Network connectivity and throughput.
Policies ·         isi dm policies list/view

·         isi dm base-policies list/view

Copy and dataset policy execution and transfer.
Service ·         isi services -a isi_dm_d <enable/disable> Daemon configuration and control.
Snapshots ·         isi snapshot snapshots list/view Snapshot execution and access.
System ·         isi dm throttling settings CPU load and system performance.

SmartSync info and errors are typically written to /var/log/isi_dm.log and /var/log/messages, while DM jobs transfer failures generate a log specific to the job ID under /ifs/data/Isilon_Support/datamover/transfer_failures.

Once a policy is running, the job status is reported via ‘isi dm jobs list’. Once complete, job histories are available by running ‘isi dm historical jobs list’. More details for a specific job can be glean from the ‘isi dm job view’ command, using the pertinent job ID from the list output above. Additionally, the ‘isi_datamover_job_status’ command with the job ID as an argument will also supply detailed information about a specific job.

Once running, a DM job can be further controlled via the ‘isi dm jobs modify’ command, and available actions include cancel, partial-completion, pause, or resume.

If a certificate authority (CA) is not correctly configured on a PowerScale cluster, the SmartSync daemon will not start, even though accounts and policies can still be configured. Be aware that the failed policies will not be reported via ‘isi dm jobs list’ or ‘isi dm historical-jobs list’ since they never started. Instead, an improperly configured CA is reported in the /var/log/isi_dm.log as follows:

Certificates not correctly installed, Data Mover service sleeping: At least one CA must be installed: No such file or directory from dm_load_certs_from_store (/b/mnt/src/isilon/lib/isi_dm/isi_dm_remote/src/rpc/dm_tls.cpp:197 ) from dm_tls_init (/b/mnt/src/isilon/lib/isi_dm/isi_dm_remote/src/rpc/dm_tls.cpp:279 ): Unable to load certificate information

Once a CA and identity are correctly configured, the SmartSync service automatically activates. Next, SmartSync attempts a handshake with the target cluster. If the CA or identity is mis-configured, the handshake process fails, and generates an entry in /var/log/isi_dm.log. For example:

2022-06-30T12:38:17.864181+00:00 GEN-HOP-NOCL-RR-1(id1) isi_dm_d[52758]: [0x828c0a110]: /b/mnt/src/isilon/lib/isi_dm/isi_dm_remote/src/acct_mon.cpp:dm_acc tmon_try_ping:348: [Fiber 3778] ping for account guid: 0000000000000000c4000000000000000000000000000000, result: dead

Note that the full handshake error detail is logged if the SmartSync service (isi_dm_d) is set to log at the ‘info’ or ‘debug’ level using isi_ilog:

# isi_ilog -a isi_dm_d --level info+

Valid ilog levels include:

fatal error err notice info debug trace

error+ err+ notice+ info+ debug+ trace+

A copy or repeat-copy policy requires an available dataset for replication before running. If a dataset has not been successfully created prior to the copy or repeat-copy policy job starting for the same base path, the job is paused. In the following example, the base path of the copy policy is not the same as that of the dataset policy, hence the job fails with a “path doesn’t match…” error.

# ls -l /ifs/data/Isilon_support/Datamover/transfer_failures

Total 9

-rw-rw----   1 root  wheel  679  June 29 10:56 baseline_failure_10

# cat /ifs/data/Isilon_support/Datamover/transfer_failures/baseline_failure_10

Task_id=0x00000000000000ce, task_type=root task ds base copy, task_state=failed-fatal path doesn’t match dataset base path: ‘/ifs/test’ != /ifs/data/repeat-copy’:

from bc_task)initialize_dsh (/b/mnt/src/isilon/lib/isi_dm/isi_dm/src/ds_base_copy

from dmt_execute (/b/mnt/src/isilon/lib/isi_dm/isi_dm/src/ds_base_copy_root_task

from dm_txn_execute_internal (/b/mnt/src/isilon/lib/isi_dm/isi_dm_base/src/txn.cp

from dm_txn_execute (/b/mnt/src/isilon/lib/isi_dm/isi_dm_base/src/txn.cpp:2274)

from dmp_task_spark_execute (/b/mnt/src/isilon/lib/isi_dm/isi_dm/src/task_runner.

Once any errors for a policy have been resolved, the ‘isi dm jobs modify’ command can be used to resume the job.